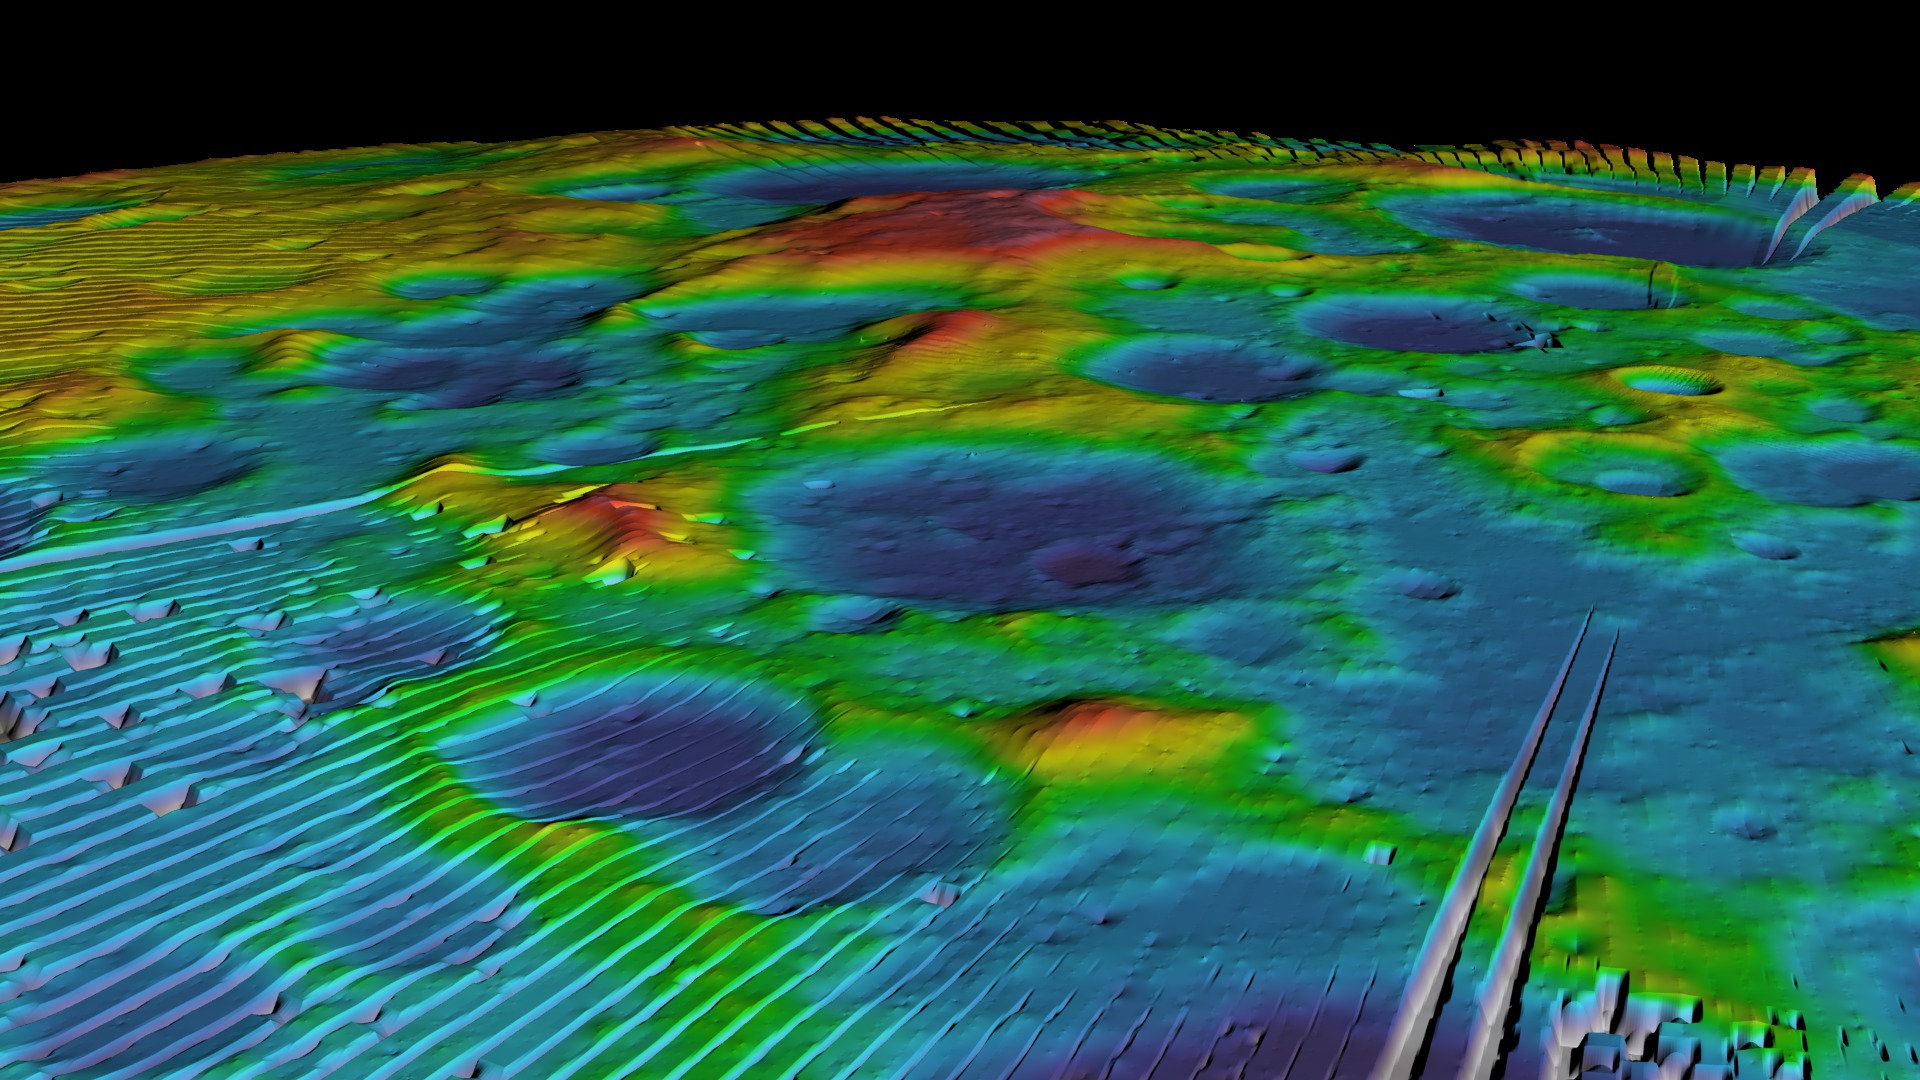
Lunar South Pole Terrain in Coded Color
The camera flies toward and then around the Moon's South Pole as the natural surface color changes to colors that encode elevation. Thirty features at the South Pole are identified.
Three months after the launch of Lunar Reconnaissance Orbiter (LRO) on June 18, 2009, the mission released its first batch of elevation measurements of the area around the lunar south pole. Fourteen years, 60,000 orbits, and over 10 billion laser shots later, LRO's picture of the south pole landscape has filled in nicely. LRO's detailed terrain maps will be vital for both human and robotic explorers scheduled to arrive at south pole locations in the coming years.

An image of the Moon's South Pole colored by elevation, with labels for 29 craters and the recently named Mons Mouton.
The colors used to show elevation at the South Pole of the Moon.
The camera flies toward and then around the Moon's South Pole as the realistic shadows brighten to make the terrain on the night side visible. Thirty features at the South Pole are labeled.
The camera flies to the Moon's South Pole and shows realistic illumination during two lunar days, with shadows rotating counterclockwise. Thirty features at the South Pole are labeled.
The camera flies toward and then around the Moon's South Pole as the natural surface color changes to colors that encode elevation. After flying around, the elevation colors are replaced by the natural color with realistic illumination showing the rotating shadows over two lunar days. Thirty features at the South Pole are identified. This movie has also been rendered as a 9600 x 3240 hyperwall frame sequence.
Credits
Please give credit for this item to:
NASA's Scientific Visualization Studio
-
Visualizers
-
Ernie Wright
(USRA)

-
Alex Kekesi
(Global Science and Technology, Inc.)
-
Ernie Wright
(USRA)
-
Producer
- David Ladd (Advocates in Manpower Management, Inc.)
-
Scientist
-
Noah Petro
(NASA/GSFC)
-
Noah Petro
(NASA/GSFC)
-
Technical support
- Laurence Schuler (ADNET Systems, Inc.)
- Ian Jones (ADNET Systems, Inc.)
Missions
This page is related to the following missions:Series
This page can be found in the following series:Datasets used
-
DEM (Digital Elevation Map) [LRO: LOLA]
ID: 653 -
SLDEM2015 (DIgital Elevation Model) [LRO/SELENE: LOLA/TC]
ID: 948A digital elevation model of the Moon derived from the Lunar Orbiter Laser Altimeter and the SELENE Terrain Camera. See the description in Icarus. The data is here.
See all pages that use this dataset -
LROC WAC Color Mosaic (Natural Color Hapke Normalized WAC Mosaic) [Lunar Reconnaissance Orbiter: LRO Camera]
ID: 1015This natural-color global mosaic is based on the 'Hapke normalized' mosaic from LRO's wide-angle camera. The data has been gamma corrected, white balanced, and range adjusted to more closely match human vision.
See all pages that use this dataset
Note: While we identify the data sets used on this page, we do not store any further details, nor the data sets themselves on our site.
Related
Older Versions
- ID: 3633
Release date
This page was originally published on Saturday, July 22, 2023.
This page was last updated on Friday, August 29, 2025 at 1:26 PM EDT.