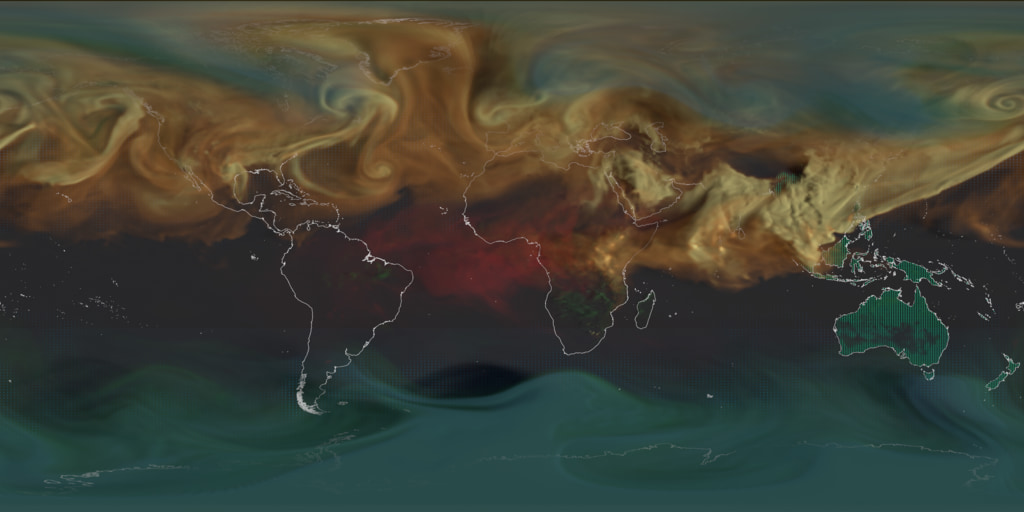
Global Atmospheric Methane (CH₄)
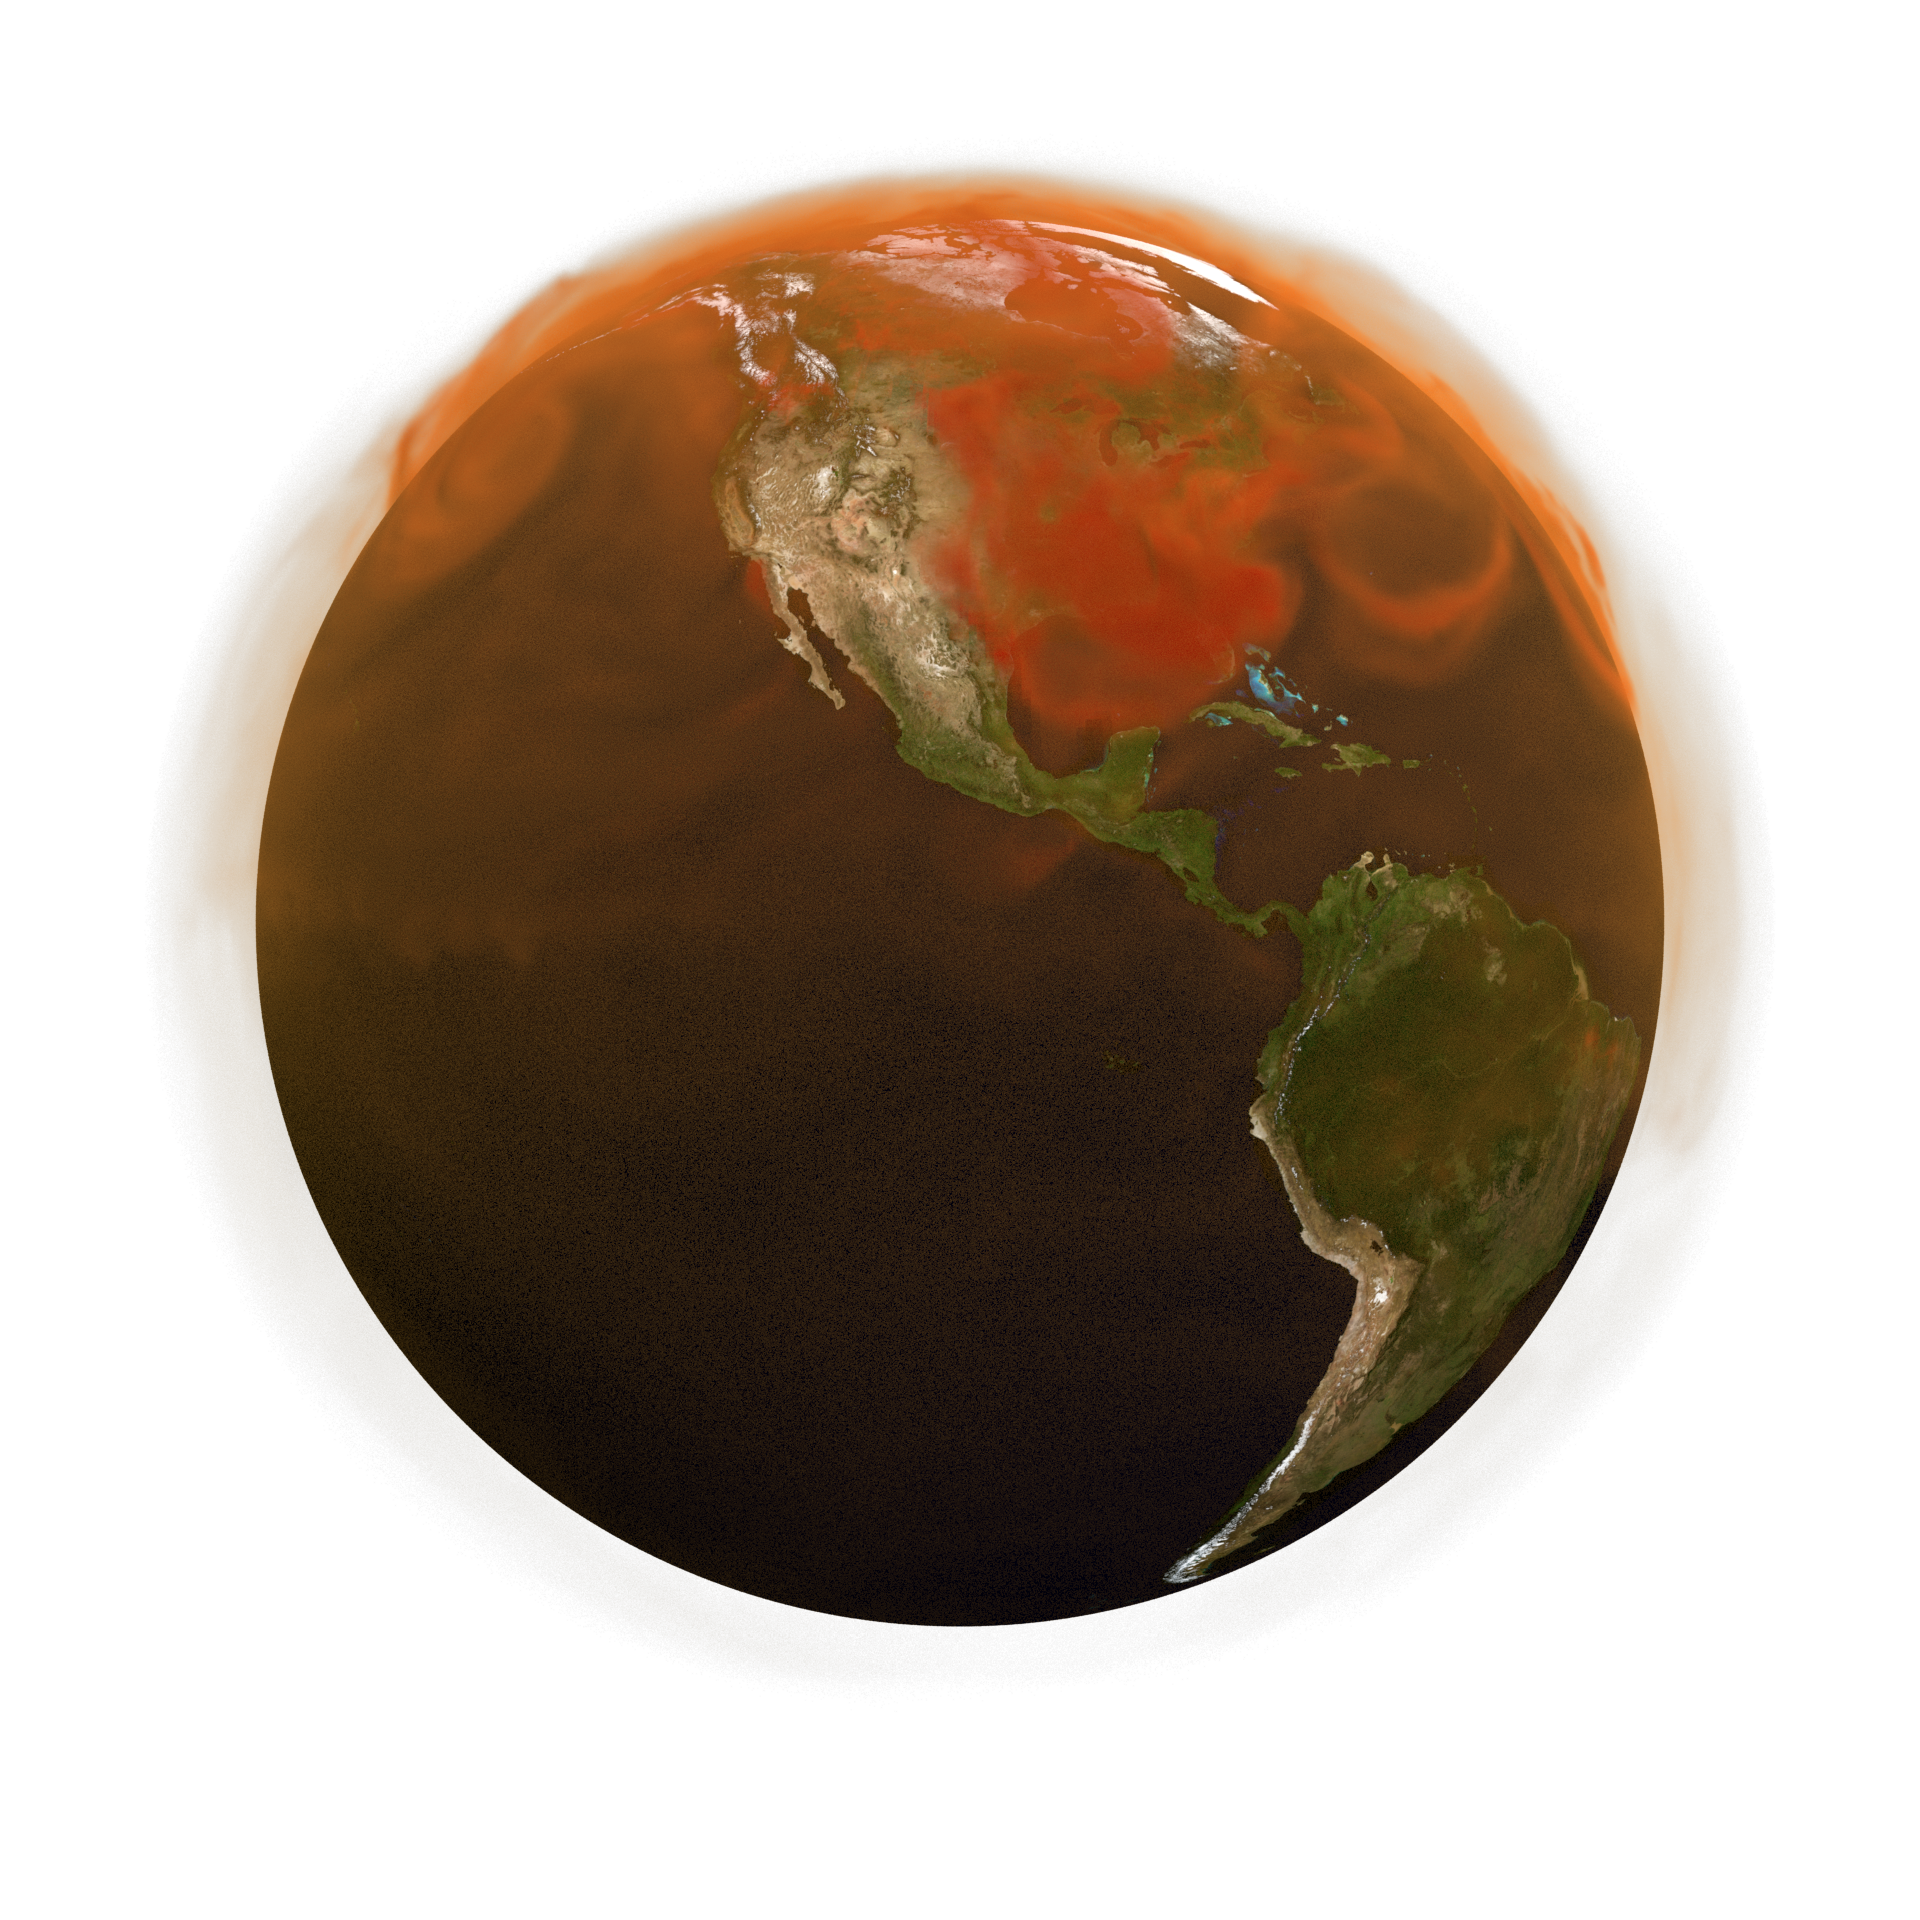
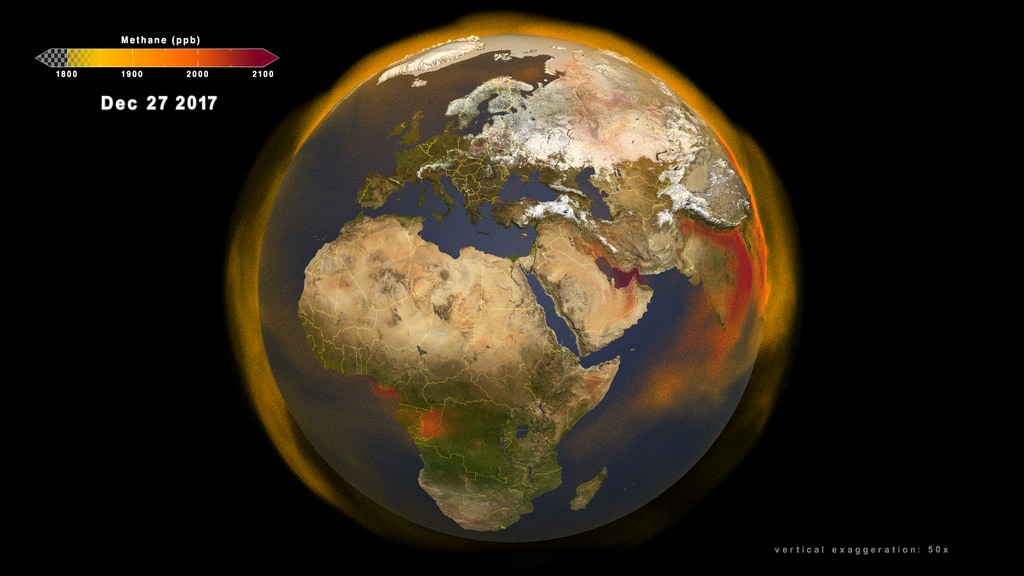
Volumetric visualization of the total Methane (CH₄) on a global scale added on Earth's atmosphere over the course of the year 2021.
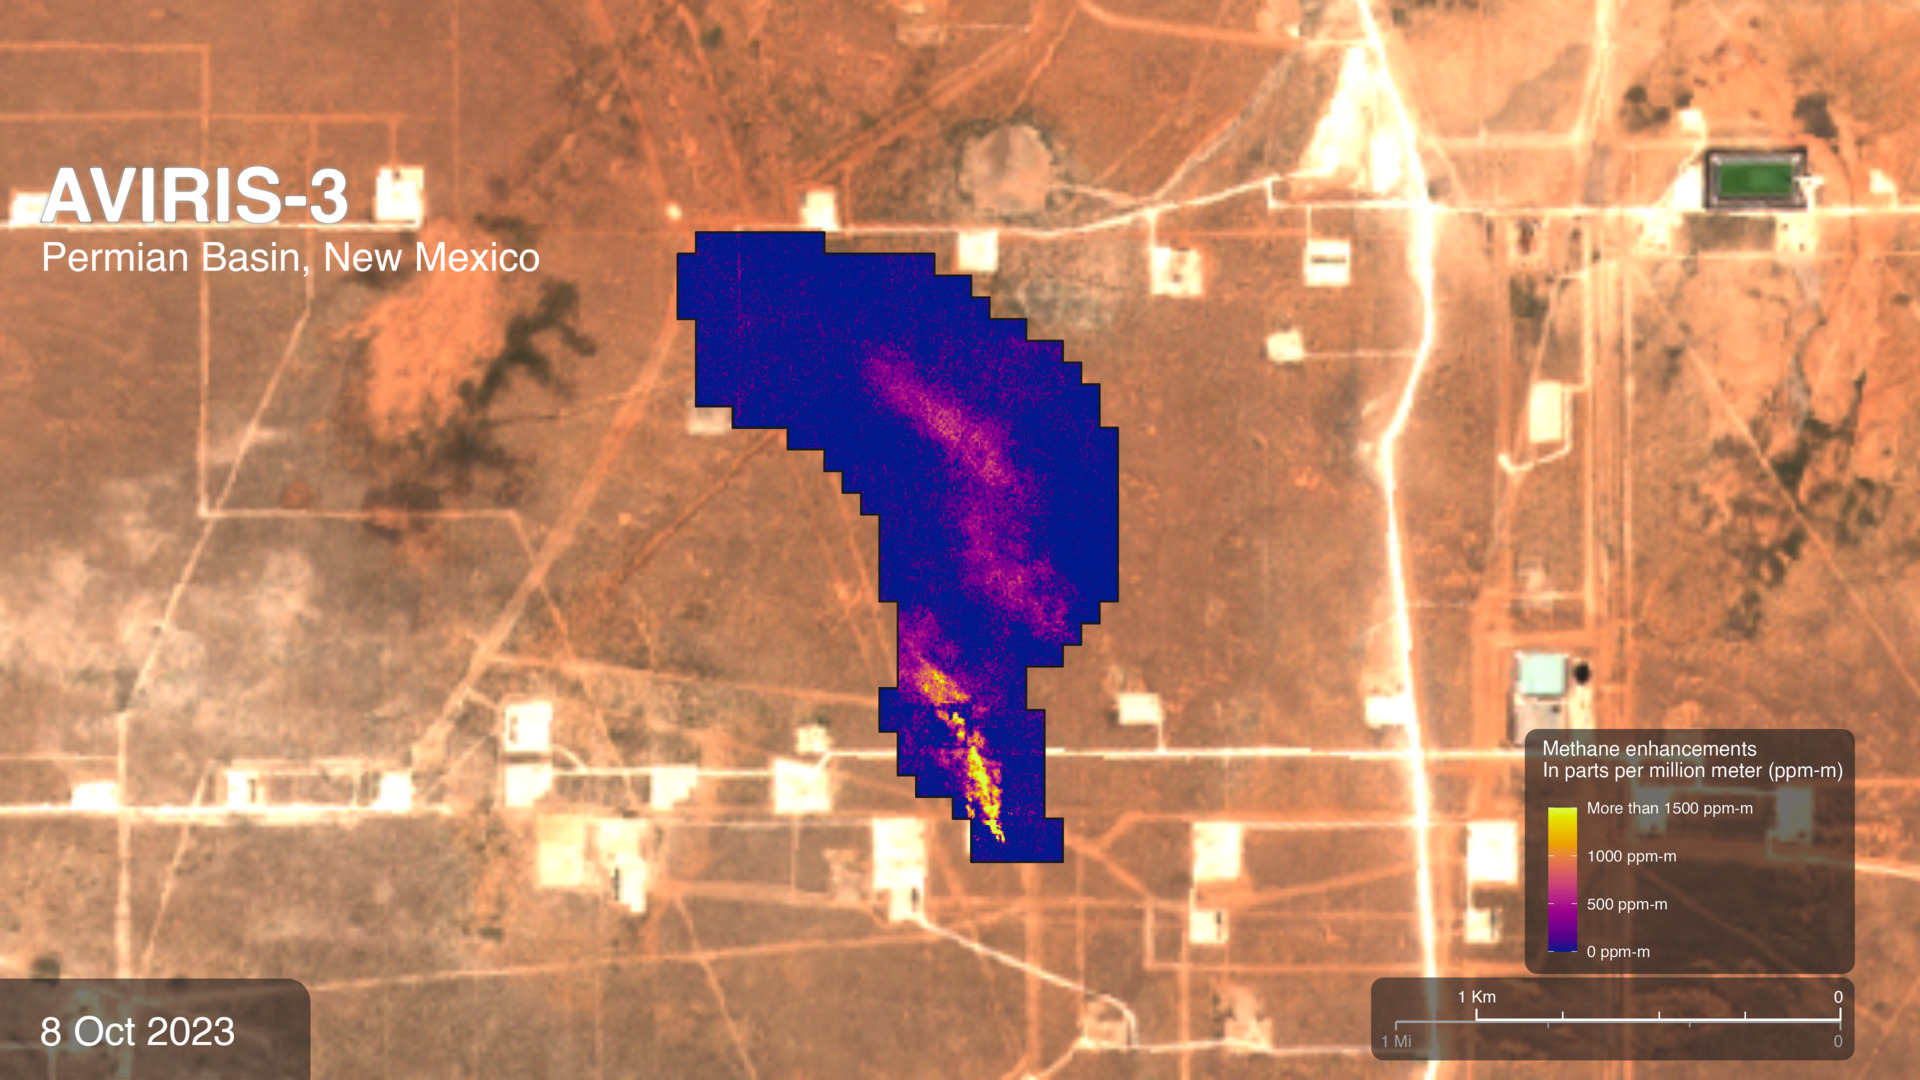
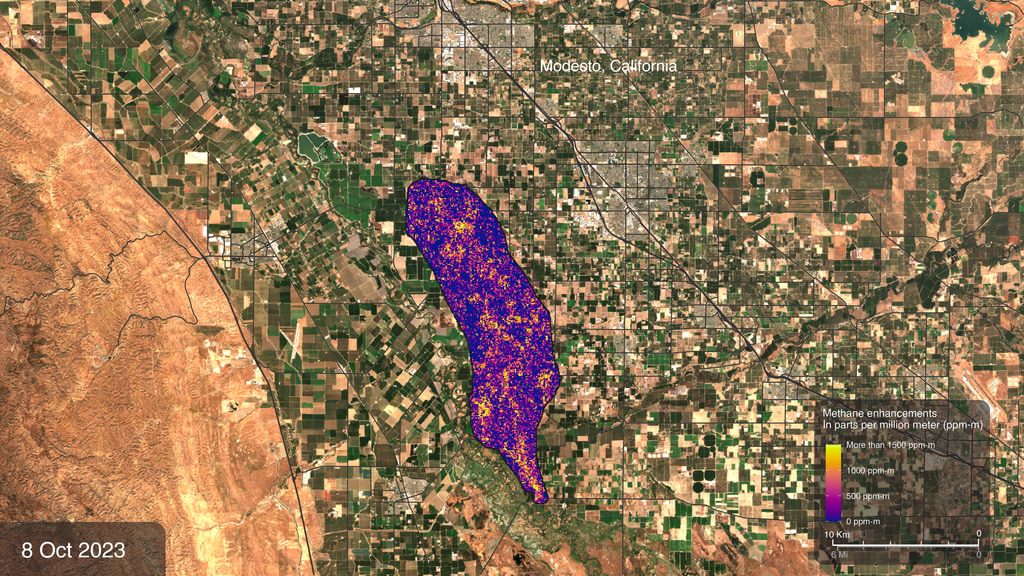
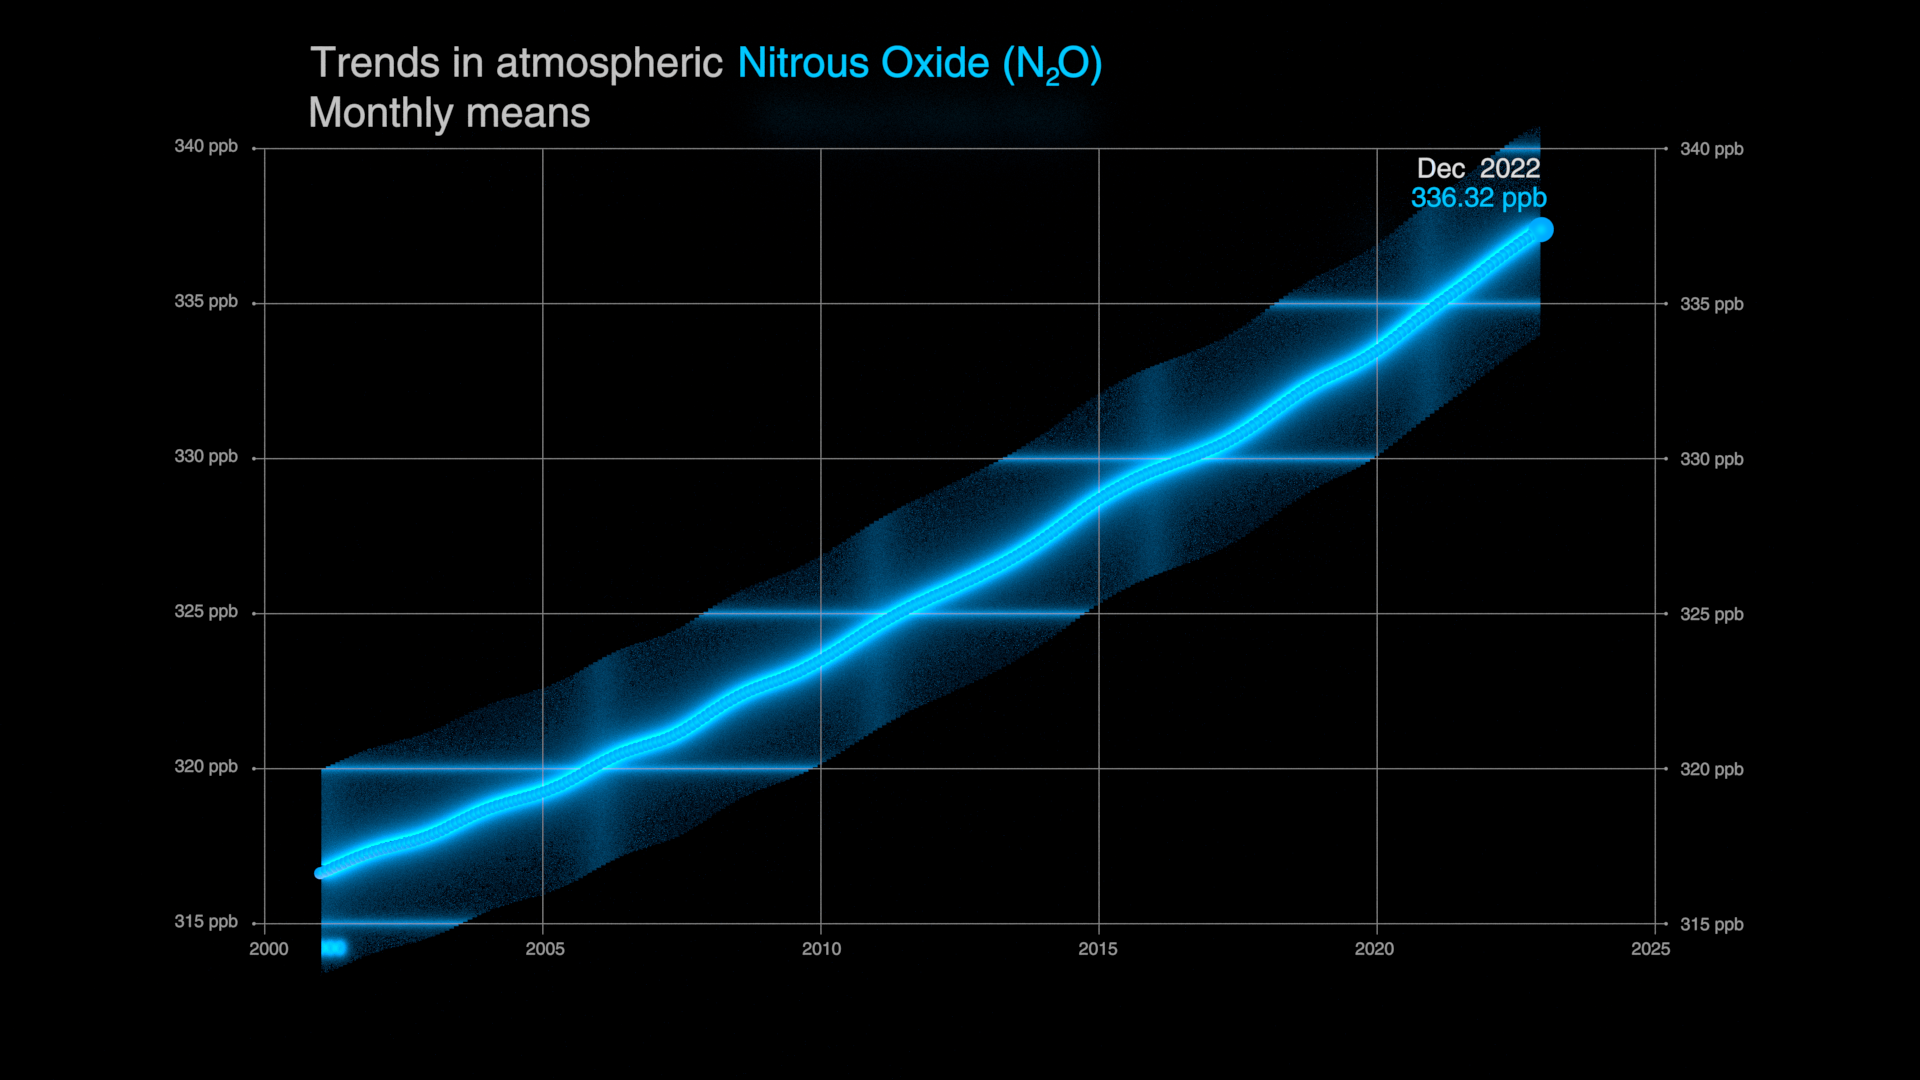
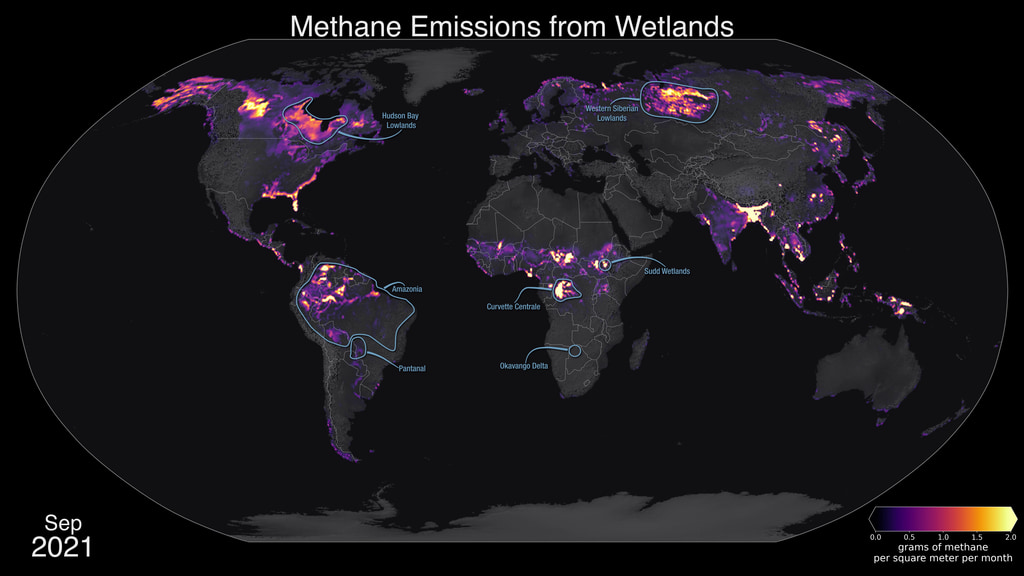
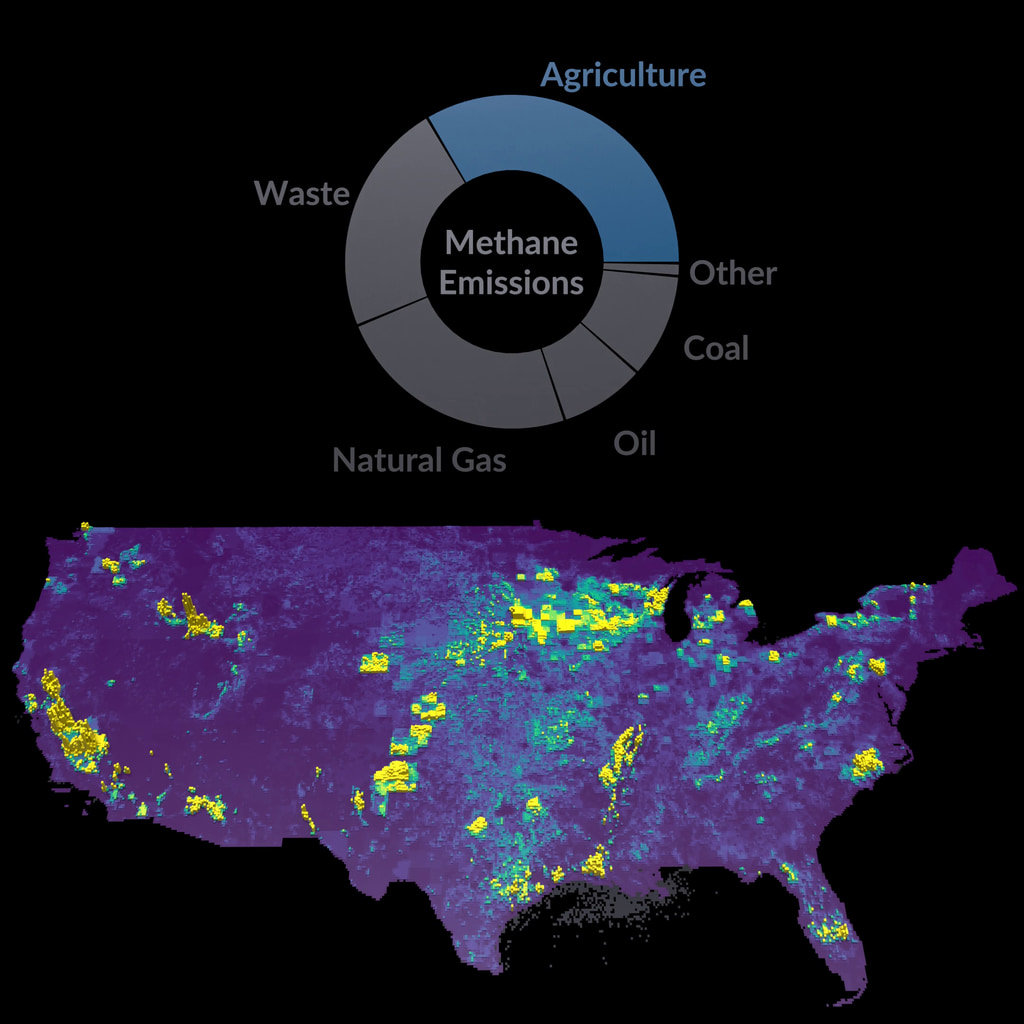
Methane (CH₄) is a powerful greenhouse gas that traps heat 28 times more effectively than carbon dioxide over a 100-year timescale. Concentrations of methane have increased by more than 150% since industrial activities and intensive agriculture began. After carbon dioxide, methane is responsible for about 20% of climate change in the twentieth century. Methane is produced under conditions where little to no oxygen is available. About 30% of methane emissions are produced by wetlands, including ponds, lakes and rivers. Another 20% is produced by agriculture, due to a combination of livestock, waste management and rice cultivation. Activities related to oil, gas, and coal extraction release an additional 30%. The remainder of methane emissions come from minor sources such as wildfires, biomass burning, permafrost, termites, dams, and the ocean. Scientists around the world are working to better understand the budget of methane with the ultimate goals of reducing greenhouse gas emissions and improving prediction of environmental change.
The NASA SVS visualization presented here shows the complex patterns of methane emissions produced around the globe and throughout the year from the different sources described above. The visualization was created using output from the Global Modeling and Assimilation Office (GMAO), GEOS modeling system, developed and maintained by scientists at NASA. Wetland emissions were estimated by the LPJ-wsl model, which simulates the temperature and moisture dependent methane emission processes using a variety of satellite data to determine what parts of the globe are covered by wetlands. Other methane emission sources come from inventories of human activity.
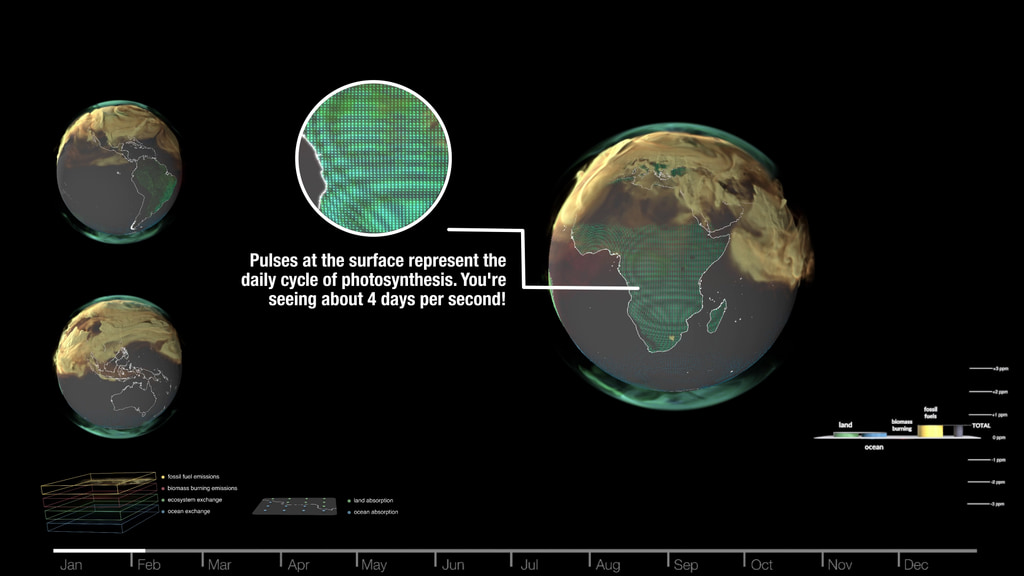
Volumetric Carbon Dioxide (CO₂) and Methane (CH₄) side-by-side on a global scale added on Earth's atmosphere over the course of year 2021.
This visualization shows the total methane on a global scale added on Earth's atmosphere over the course of the year 2021.
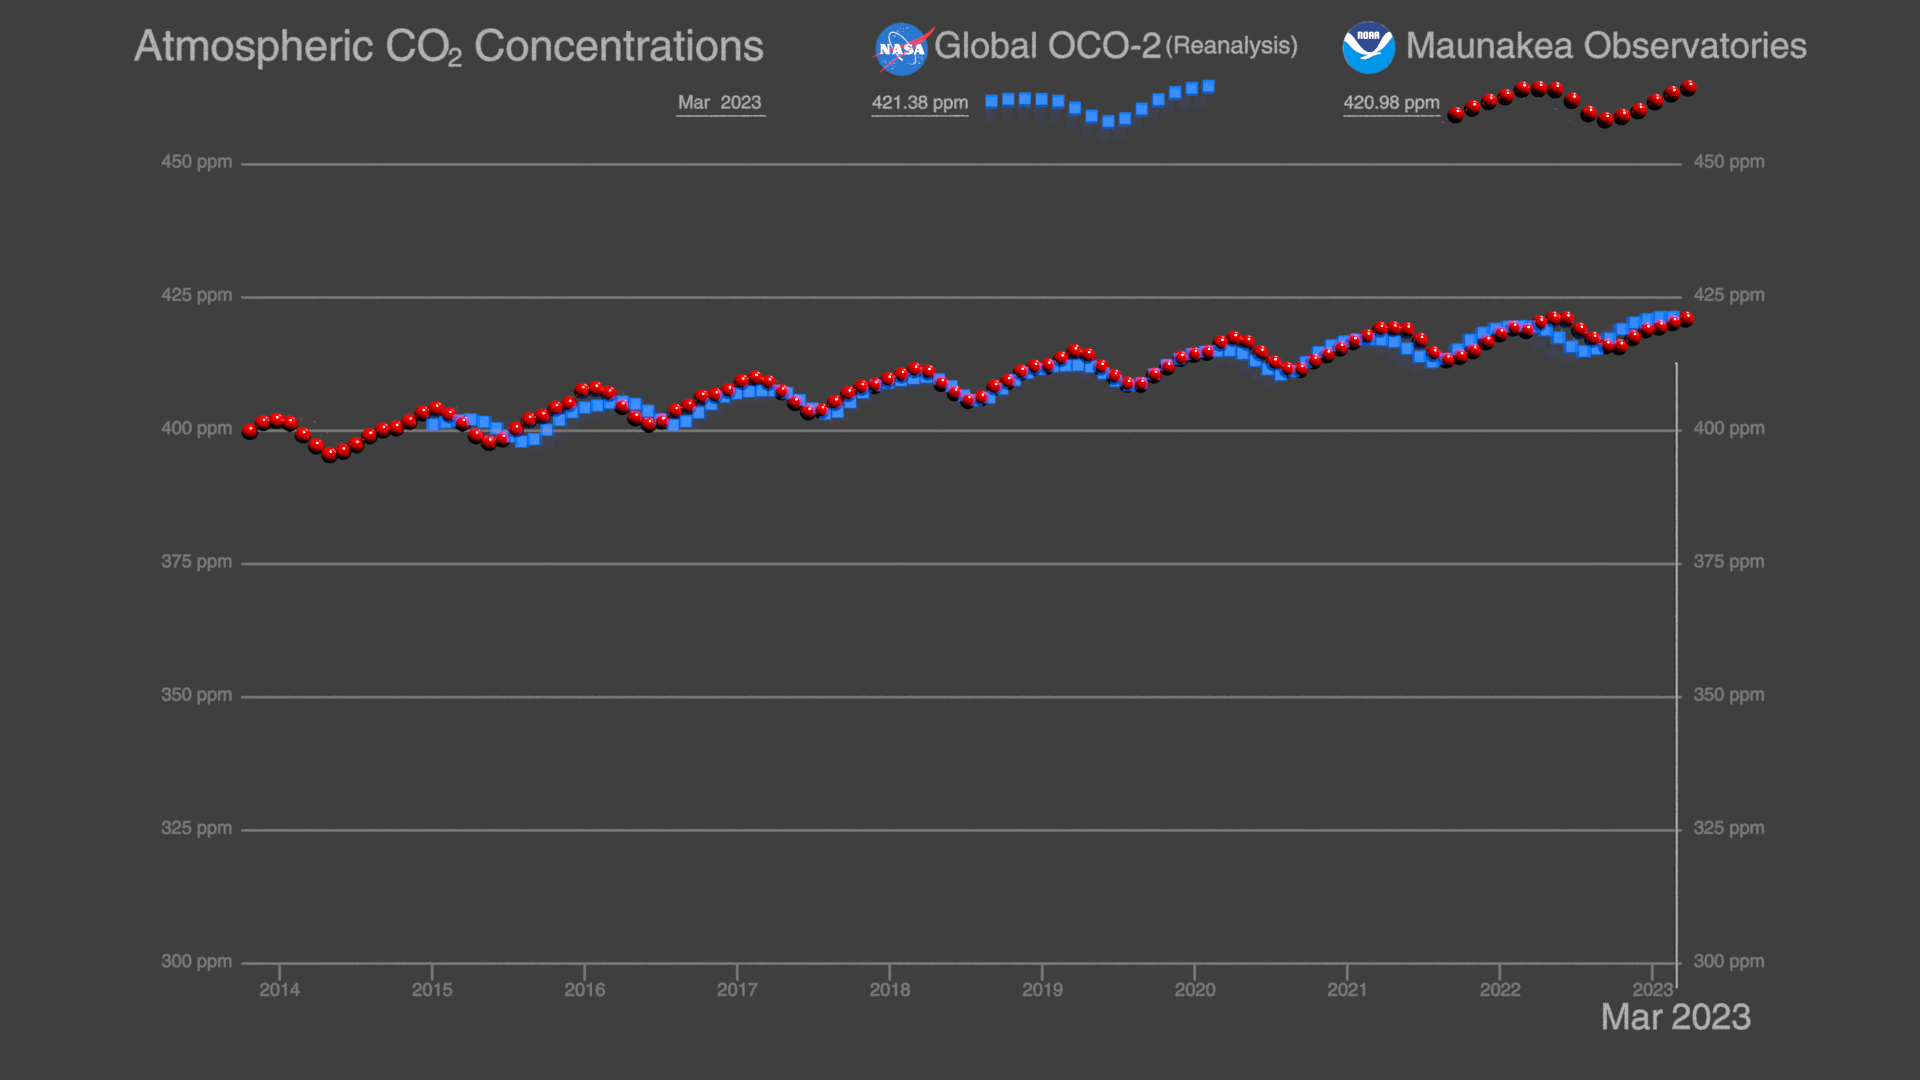
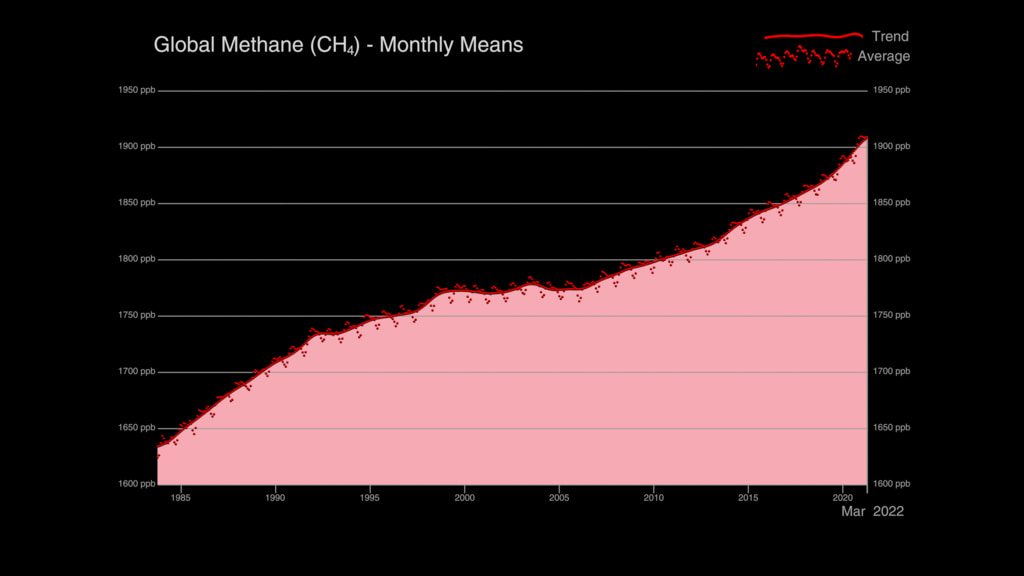
This timeline is synchronized with the atmospheric methane visualization above to show temporal progress across the year
Data Sources:
- Volumetric Methane extracted from NASA's Goddard Earth Observing System (GEOS) model, which is produced by the Global Modeling and Assimilation Office. The visualization featured on this page utilizes data for the period January 1 - December 31, 2021.
- Blue Marble: Next Generation was produced by Reto Stöckli, NASA Earth Observatory (NASA Goddard Space Flight Center). Citation: Reto Stöckli, Eric Vermote, Nazmi Saleous, Robert Simmon and David Herring.
The Blue Marble Next Generation – A true color earth dataset including seasonal dynamics from MODIS, October 17, 2005. The visualization on this page utilizes monthly Blue Marble data to map the water and land bodies around the globe and show seasonal changes. - Global 30 Arc-Second Elevation (GTOPO 30) from U.S. Geological Survey (USGS). GTOPO30 is a global raster digital elevation model (DEM) with a horizontal grid spacing of 30 arc seconds (approximately 1 kilometer). GTOPO30 was derived from several raster and vector sources of topographic information. The data-driven visualization featured on this page utilizes the GTOPO30 model to represent the three-dimensional features of over land terrain and submarine topography world-wide. doi:10.5066/F7DF6PQS.
Credits
Please give credit for this item to:
NASA's Scientific Visualization Studio
-
Visualizers
-
Helen-Nicole Kostis
(USRA)

-
AJ Christensen
(SSAI)
-
Helen-Nicole Kostis
(USRA)
-
Scientists
-
Lesley Ott
(NASA/GSFC)
- Brad Weir (Morgan State University)
-
Lesley Ott
(NASA/GSFC)
-
Technical support
- Laurence Schuler (ADNET Systems, Inc.)
- Ian Jones (ADNET Systems, Inc.)
Related papers
Sweeney, C., Chatterjee, A., Wolter, S., McKain, K., Bogue, R., Conley, S., Newberger, T., Hu, L., Ott, L., Poulter, B., Schiferl, L., Weir, B., Zhang, Z., and Miller, C. E.: Using atmospheric trace gas vertical profiles to evaluate model fluxes: a case study of Arctic-CAP observations and GEOS simulations for the ABoVE domain, Atmos. Chem. Phys., 22, 6347–6364, https://doi.org/10.5194/acp-22-6347-2022, 2022
Sweeney, C., Chatterjee, A., Wolter, S., McKain, K., Bogue, R., Conley, S., Newberger, T., Hu, L., Ott, L., Poulter, B., Schiferl, L., Weir, B., Zhang, Z., and Miller, C. E.: Using atmospheric trace gas vertical profiles to evaluate model fluxes: a case study of Arctic-CAP observations and GEOS simulations for the ABoVE domain, Atmos. Chem. Phys., 22, 6347–6364, https://doi.org/10.5194/acp-22-6347-2022, 2022
Datasets used
-
GTOPO30 Topography and Bathymetry
ID: 274 -
BMNG (Blue Marble: Next Generation) [Terra and Aqua: MODIS]
ID: 508Credit: The Blue Marble data is courtesy of Reto Stockli (NASA/GSFC).
This dataset can be found at: http://earthobservatory.nasa.gov/Newsroom/BlueMarble/
See all pages that use this dataset -
GMAO GEOS Atmospheric Methane (GMAO GEOS Atmospheric Methane)
ID: 1066
Note: While we identify the data sets used on this page, we do not store any further details, nor the data sets themselves on our site.
Related
- ID: 5389
 Visualization
 - ID: 5272
 Visualization
 - ID: 5273
- ID: 5119
- ID: 5117
 Visualization
 - ID: 5115
 Visualization
 - ID: 5110
 Visualization
 - ID: 5054
 Visualization
 - ID: 5041
 Visualization
 - ID: 5007
 Visualization
 - ID: 4890
- ID: 4789
 Visualization
 - ID: 13047
![Music: Coveted Jewels by Reuben James Cornell [PRS]Complete transcript available.](/vis/a010000/a013000/a013047/Bubbles_Still.png)
Used as a Source In
- ID: 14568
Release date
This page was originally published on Tuesday, June 20, 2023.
This page was last updated on Sunday, March 16, 2025 at 11:03 PM EDT.