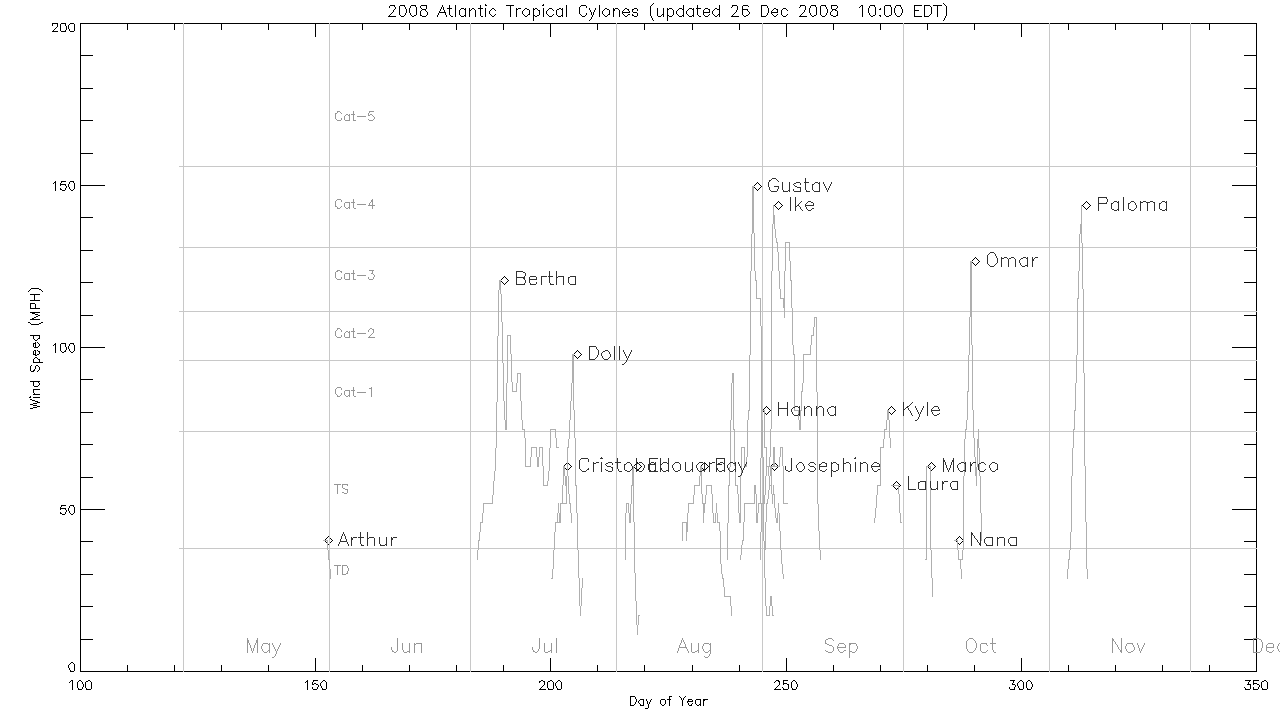
Atlantic Hurricane Wind Speed Plots
Atlantic Hurricane season plot of time vs. wind speed. This version shows:
- May through December
- each year separately
These simple visualizations are plots of time vs. wind speed for each tropical storm/hurricane of Atlantic Hurricane seasons from 1950 to the present. Horizontal lines indicate wind speed category thresholds. A line plot for each storm shows the storm's name and a marker at the peak wind speed.
Most named storms during the Atlantic hurricane season happen between June and November. However, occasionally, storms develop outside of those ranges.
Four versions of the plots are inluded:
1. May to December showig only the current year
2. May to December showing the current year and strong storms from previous years (ghosted out)
3. January to December showig only the current year
4. January to December showing the current year and strong storms from previous years (ghosted out)
The plot for the current year automatically updates every 2 hours during hurricane season.
Atlantic Hurricane season plot of time vs. wind speed. This version shows:
• May through December
• current year and previous years
Atlantic Hurricane season plot of time vs. wind speed. This version shows:
• January through December
• current year and previous years
Atlantic Hurricane season plot of time vs. wind speed. This version shows:
• January through December
• each year separately
Credits
Please give credit for this item to:
NASA/Goddard Space Flight Center Scientific Visualization Studio Storm wind speeds provided by NOAA's National Weather Service via UNISYS
-
Visualizer
-
Greg Shirah
(NASA/GSFC)
-
Greg Shirah
(NASA/GSFC)
Series
This page can be found in the following series:Datasets used
-
HURDAT2
ID: 879 -
Hurricane Tracks (Automated Tropical Cyclone Forecast (ATCF) - Best Track)
ID: 1109Credit: NOAA
This dataset can be found at: https://ftp.nhc.noaa.gov/atcf/
See all pages that use this dataset
Note: While we identify the data sets used on this page, we do not store any further details, nor the data sets themselves on our site.
Release date
This page was originally published on Monday, July 10, 2023.
This page was last updated on Wednesday, April 16, 2025 at 2:00 PM EDT.
