Parker Solar Probe: Crossing the Alfven Surface
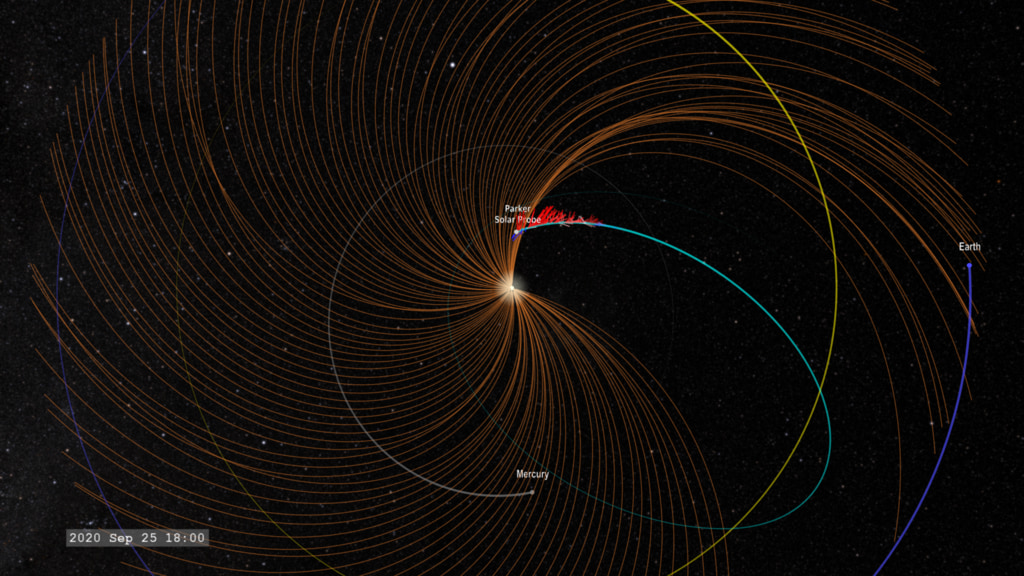
Split window view illustrating the orbit of Parker with the orbit trail colored based on the Mach number of the solar wind and the magnetic field lines (represented as gold) connecting back to the Sun. The Mach number drops below unity (one) when a field line transitions between two different coronal hole regions (the blue and red regions marked on the Sun).
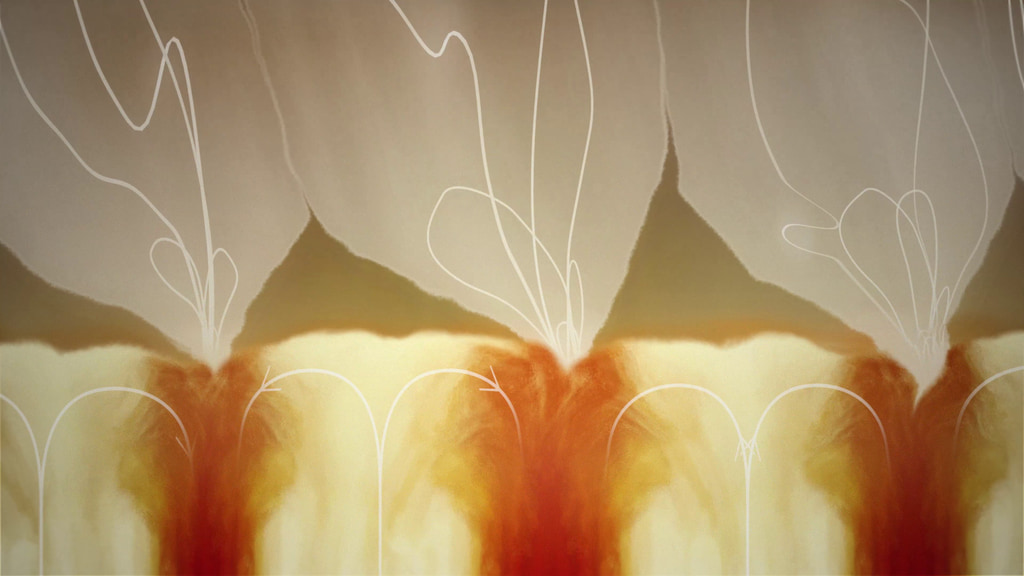
The Sun's corona extends far beyond the solar surface, or photosphere and is considered the outer boundary of the Sun. It marks the transition to the solar wind which moves through the solar system. This limit is defined by the distance at which disturbances in the solar wind cannot propagate back to the solar surface. Those disturbances cannot propagate back towards the Sun if the outbound solar wind speed exceeds Mach one, the speed of 'sound' as defined for the solar wind. This distance forms an irregular 'surface' around the Sun called the Alfvén surface.
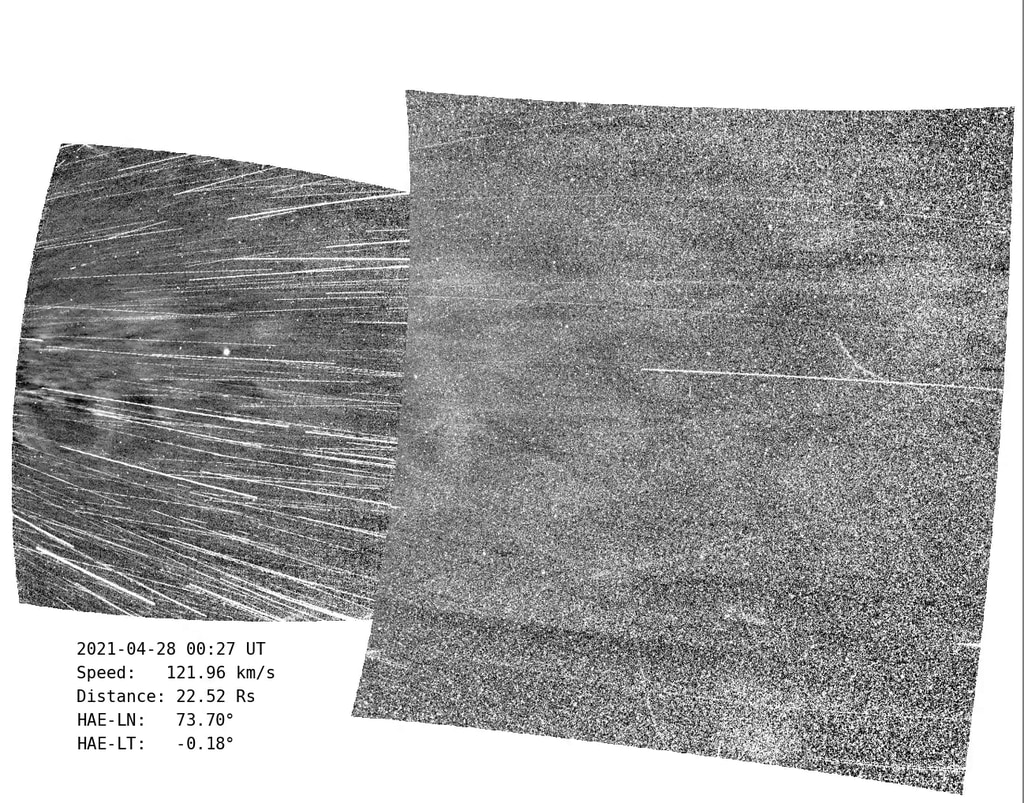
Parker Solar Probe has now reached close enough to the Sun that it has begun to penetrate this Alfvén surface. From measurements of the solar wind plasma environment by the Parker's FIELDS and SWEAP instruments, scientists can compute the 'speed of sound' for the plasma, which exhibits brief periods when the Mach number drops below unity (one).
At Parker's distance during encounter 8, the Mach number dropped below unity on several occasions. Propagating the magnetic field vector at Parker back to the solar photosphere revealed that these regions corresponded to significant changes in the magnetic field on the photosphere, particularly that fields lines of 'open' magnetic flux were transitioning from one location to another.
In the visualizations below, we see the measured Mach number at Parker propagated along the orbit, with green representing Mach number greater than one, grey represents Mach number approximately one, and red represents Mach number less than one. When we trace the field lines at these moments back to the Sun, we see the field line jumping between isolated regions of 'open' magnetic flux - blue for inward magnetic flux and red for outbound magnetic flux.
A visualization illustrating the orbit of Parker, orbit trail colored based on the Mach number of the solar wind, with the magnetic field lines (represented in gold) connecting back to the Sun. The Mach number drops below unity (one) when a field line transitions between two different coronal hole regions (the blue and red regions marked on the Sun).
A visualization illustrating the magnetic field lines connecting Parker Solar Probe back to the Sun. When the Mach number in the solar wind drops below unity (one), the field line (gold) transitions between two different coronal hole regions (the blue and red regions marked on the Sun).
A top-down view from the ecliptic pole of the orbit of Parker Solar Probe for Encounter 8. FIELDS instrument magnetic vector data are projected from the spacecraft position as arrows. The arrows are deep blue for sunward vectors, deep red for anti-sunward, and in between for directions off from this line. The heliospheric magnetic field lines are the gold lines, representing the propagation of the average field measured at Parker, propagated back to the solar photosphere.
A top-down view from the ecliptic pole of the orbit of Parker Solar Probe for Encounter 8.
View of FIELDS instrument data measured at Parker Solar Probe during encounter 8. FIELDS magnetic vector data are projected from the spacecraft position as arrows. The arrows are colored deep blue for sunward vectors, deep red for anti-sunward, and in between for directions off from this line. The heliospheric magnetic field lines are the gold lines, representing the propagation of the average field measured at Parker, propagated back to the solar photosphere.
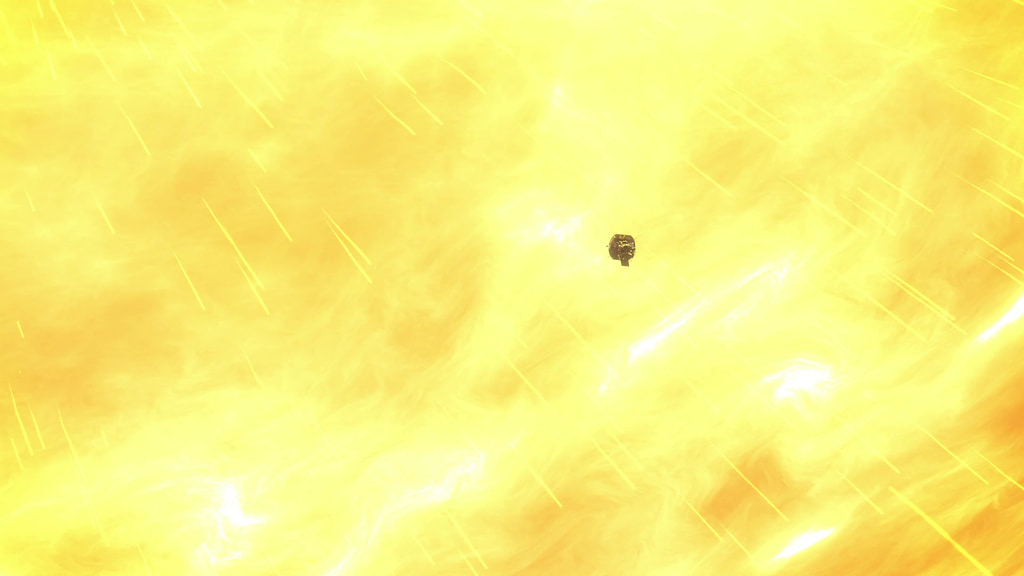
A visualization from behind Parker Solar Probe as it approaches the Sun on Encounter 8.
Credits
Please give credit for this item to:
NASA's Scientific Visualization Studio
-
Visualizer
- Tom Bridgman (Global Science and Technology, Inc.)
-
Scientists
- Justin Kasper (University of Michigan)
- Samuel Badman (University of California at Berkeley)
- Jia Huang (University of Michigan)
- David Stansby (University College London)
-
Producer
- Joy Ng (KBR Wyle Services, LLC)
-
Writer
- Mara Johnson-Groh (Wyle Information Systems)
-
Technical support
- Laurence Schuler (ADNET Systems, Inc.)
- Ian Jones (ADNET Systems, Inc.)
Missions
This page is related to the following missions:Series
This page can be found in the following series:Datasets used
-
SPICE Ephemerides (SPICE Ephemerides)
ID: 755Satellite and planetary ephemerides
See all pages that use this dataset -
FIELDS [Parker Solar Probe: FIELDS]
ID: 1132Measurements of electric and magnetic fields and waves.
This dataset can be found at: https://fields.ssl.berkeley.edu/
See all pages that use this dataset
Note: While we identify the data sets used on this page, we do not store any further details, nor the data sets themselves on our site.
Related
- ID: 14055
- ID: 4957
 Visualization
 - ID: 14035
- ID: 14036
 Produced Video
 - ID: 20354
 Animation
Used as a Source In
- ID: 14045
 Produced Video
Release date
This page was originally published on Tuesday, December 14, 2021.
This page was last updated on Monday, January 6, 2025 at 12:19 AM EST.