NASA/JAXA GPM Satellite Captures Hurricane Delta on Approach to the Gulf Coast
GPM captured Hurricane Delta the evening of October 8 at approximately 7:40pm CST. This visualization shows the heavy rain structures within the heart of the Hurricane as it moved towards the Gulf coast.
GPM passed over Hurricane Delta Thursday October 8, 2020 at appproximately 7:40pm Central Time (UTC time: 10/9/2020 00:40Z) as it approached the Gulf coast.
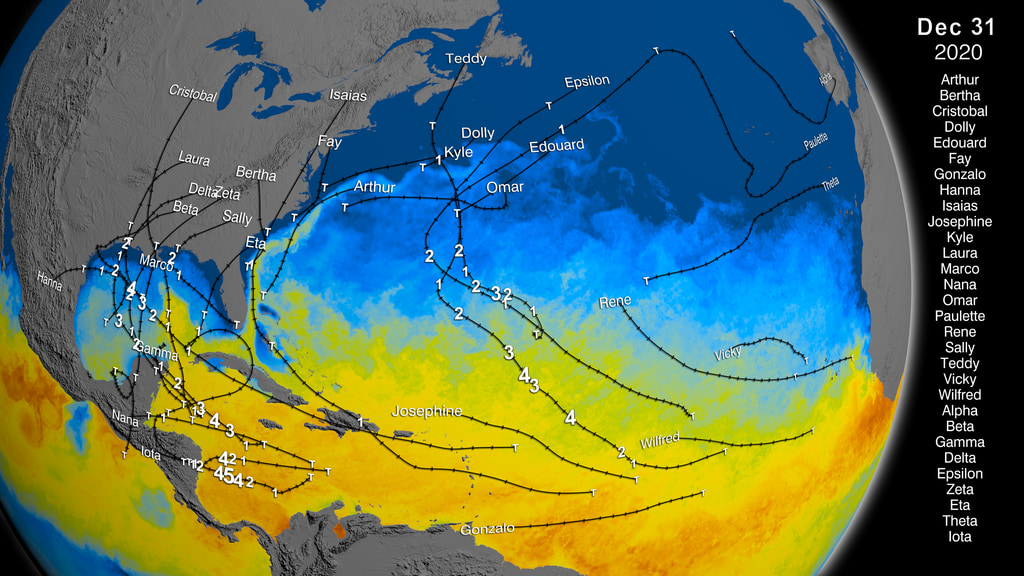
Hurricane Delta is the 25th named Atlantic storm of the 2020 hurricane season. After exhausting a list of prepared names, the World Meteorological Organization turns to the Greek alphabet to name storms. Delta marked the strongest Greek-named storm on record. Hurricanes typically get a massive boost of energy when they pass over warm waters. Hurricane Delta rapidly intensified from a tropical depression to Category 4 storm in about 30 hours.
GPM data is archived at https://pps.gsfc.nasa.gov/

Color bar for frozen precipitation rates (ie, snow rates). Shades of cyan represent low amounts of frozen precipitation, whereas shades of purple represent high amounts of precipitation.

Color bar for liquid precipitation rates (ie, rain rates). Shades of green represent low amounts of liquid precipitation, whereas shades of red represent high amounts of precipitation.
Credits
Please give credit for this item to:
NASA's Scientific Visualization Studio
-
Data visualizers
-
Alex Kekesi
(Global Science and Technology, Inc.)
-
Greg Shirah
(NASA/GSFC)
-
Alex Kekesi
(Global Science and Technology, Inc.)
-
Scientists
-
George Huffman
(NASA/GSFC)
- Dalia B Kirschbaum (NASA/GSFC)
-
George Huffman
(NASA/GSFC)
-
Producers
- Kathryn Mersmann (USRA)
- Ryan Fitzgibbons (USRA)
- Katie Jepson (USRA)
Missions
This page is related to the following missions:Series
This page can be found in the following series:Datasets used
-
Rain Rates (Surface Precipitation) [GPM: GMI]
ID: 822Credit: Data provided by the joint NASA/JAXA GPM mission.
See all pages that use this dataset -
Volumetric Precipitation data (Ku) [GPM: DPR]
ID: 830Credit: Data provided by the joint NASA/JAXA GPM mission.
See all pages that use this dataset -
IMERG
ID: 863This dataset can be found at: http://pmm.nasa.gov/sites/default/files/document_files/IMERG_ATBD_V4.4.pdf
See all pages that use this dataset
Note: While we identify the data sets used on this page, we do not store any further details, nor the data sets themselves on our site.
Release date
This page was originally published on Friday, October 9, 2020.
This page was last updated on Monday, January 6, 2025 at 12:18 AM EST.
