A newer version of this visualization is available.
Arctic Sea Ice Minimum 2020
Animation of Arctic sea ice extent from the Mar. 5, 2020 maximum to the Sept. 15, 2020 minimum, 30-year average extents in yellow
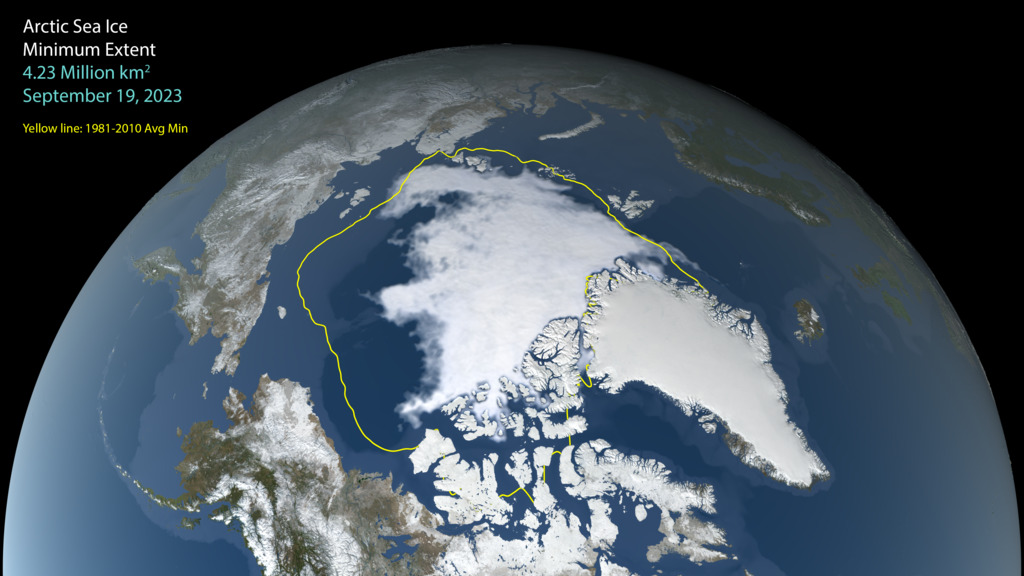
Satellite-based passive microwave images of the sea ice have provided a reliable tool for continuously monitoring changes in the Arctic ice since 1979. Every summer the Arctic ice cap melts down to what scientists call its "minimum" before colder weather begins to cause ice cover to increase. The extent of Arctic sea ice at the end of this summer was the second lowest since satellite monitoring began. An analysis of satellite data by NASA and the National Snow and Ice Data Center (NSIDC) at the University of Colorado Boulder shows that the 2020 minimum extent, which was likely reached on Sept. 15, measured 1.44 million square miles (3.74 million square kilometers).
The Japan Aerospace Exploration Agency (JAXA) provides many water-related products derived from data acquired by the Advanced Microwave Scanning Radiometer 2 (AMSR2) instrument aboard the Global Change Observation Mission 1st-Water "SHIZUKU" (GCOM-W1) satellite. Two JAXA datasets used in this animation are the 10-km daily sea ice concentration and the 10 km daily 89 GHz Brightness Temperature.
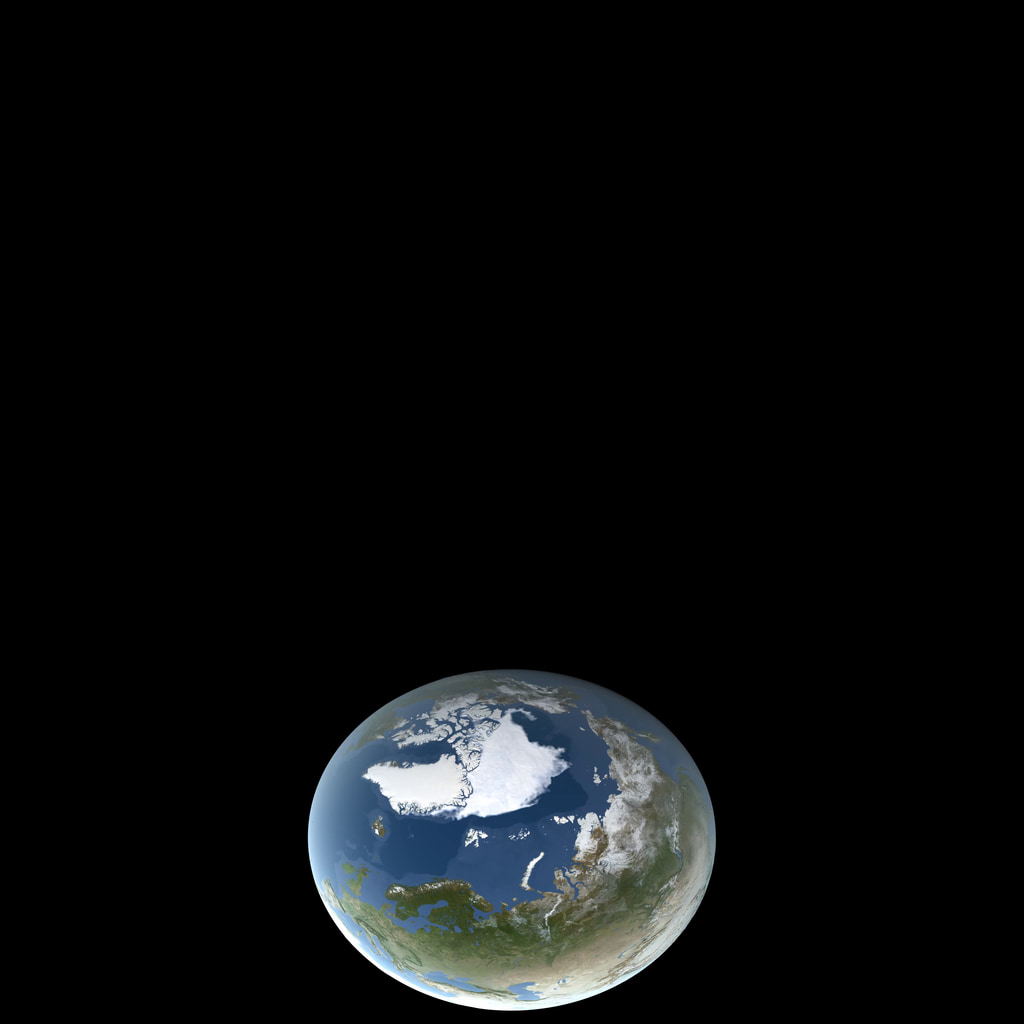
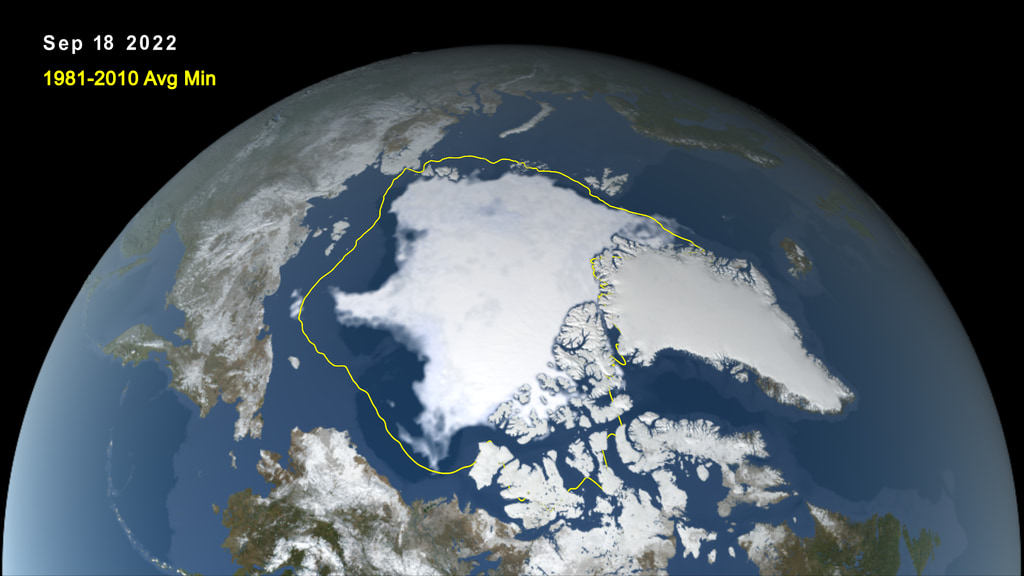
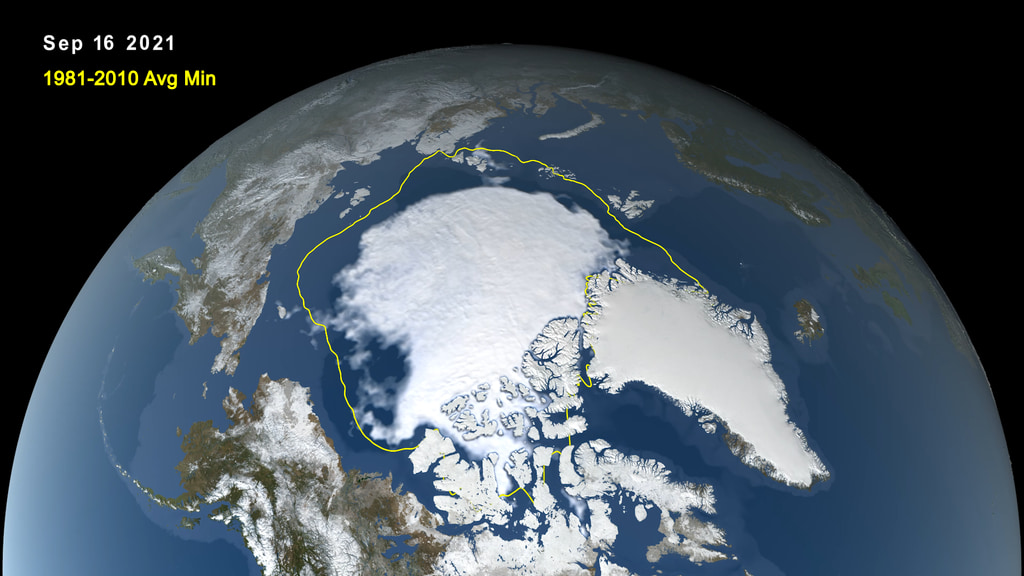
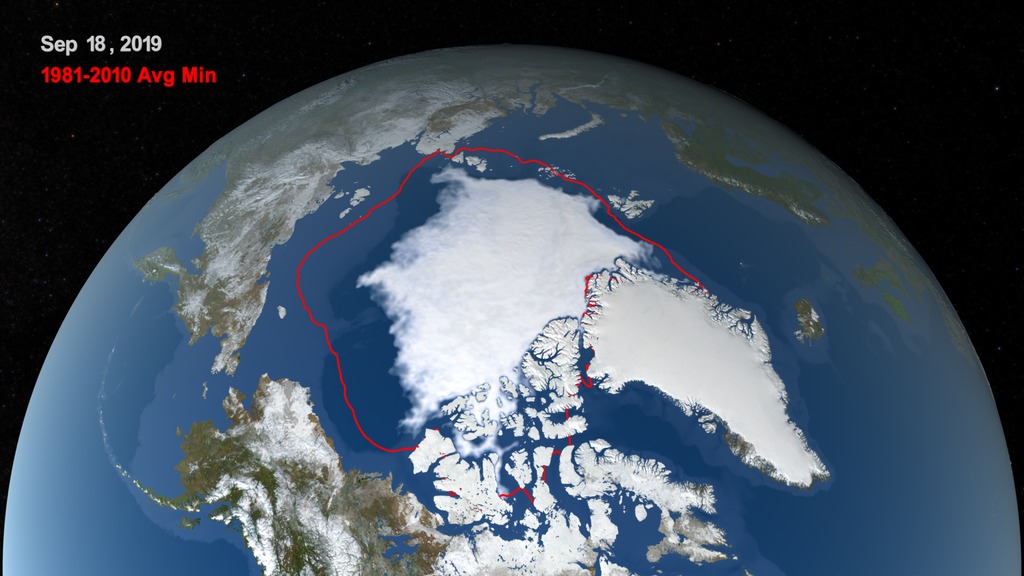
In this animation, the daily Arctic sea ice and seasonal land cover change progress through time, from the yearly maximum ice extent on March 5 2020, through its minimum on September 15 2020. Over the water, Arctic sea ice changes from day to day showing a running 3-day minimum sea ice concentration in the region where the concentration is greater than 15%. The blueish white color of the sea ice is derived from a 3-day running minimum of the AMSR2 89 GHz brightness temperature. The red boundary shows the minimum extent averaged over the 30-year period from 1981 to 2010. Over the terrain, monthly data from the seasonal Blue Marble Next Generation fades slowly from month to month. The faint circle that appears periodically close to the pole is an artifact of the visualization process, and does not represent a real feature.
Animation of Arctic sea ice extent from the Mar. 5, 2020 maximum to the Sept. 15, 2020 minimum, 30-year average extents in yellow, no text
Animation of Arctic sea ice extent from the Mar. 5, 2020 maximum to the Sept. 15, 2020 minimum, no average, no text
Animation of Arctic sea ice extent from the Mar. 5, 2020 maximum to the Sept. 15, 2020 minimum, 30-year average extents in red

Arctic sea ice minimum, Sept. 15 2020, with labels, 30-year average extents in yellow, print resolution
Arctic sea ice minimum, Sept. 15 2020, with labels, 30-year average extents in red, print resolution
Arctic sea ice minimum, Sept. 15 2020, no labels, print resolution
Credits
Please give credit for this item to:
NASA's Scientific Visualization Studio
-
Animators
- Trent L. Schindler (USRA)
-
Cindy Starr
(Global Science and Technology, Inc.)

-
Producers
- Kathleen Gaeta (GSFC Interns)
- Kathryn Mersmann (USRA)
- Jefferson Beck (USRA)
-
Writer
- Kate Ramsayer (Telophase)
Datasets used
-
BMNG (Blue Marble: Next Generation) [Terra and Aqua: MODIS]
ID: 508Credit: The Blue Marble data is courtesy of Reto Stockli (NASA/GSFC).
This dataset can be found at: http://earthobservatory.nasa.gov/Newsroom/BlueMarble/
See all pages that use this dataset -
10 km Daily Sea Ice Concentration [SHIZUKU (GCOM-W1): AMSR2]
ID: 795Credit: AMSR2 data courtesy of the Japan Aerospace Exploration Agency (JAXA).
See all pages that use this dataset -
10 km Daily 89 GHz Brightness Temperature [SHIZUKU (GCOM-W1): AMSR2]
ID: 796Credit: AMSR2 data courtesy of the Japan Aerospace Exploration Agency (JAXA).
See all pages that use this dataset
Note: While we identify the data sets used on this page, we do not store any further details, nor the data sets themselves on our site.
Related
- ID: 4927
 Visualization
 - ID: 13746

- ID: 13300
 Produced Video
Newer Versions
- ID: 5382
 Visualization
 - ID: 5162
 Visualization
 - ID: 5030
 Visualization
 - ID: 4941
 Visualization
Older Versions
- ID: 4757
 Visualization
Used as a Source In
- ID: 13799
![Music: Organic Machine by Bernhard Hering [GEMA] and Matthias Kruger [GEMA]Complete transcript available.](/vis/a010000/a013700/a013799/2020Temp.png) Produced Video
Produced Video - ID: 13722
![Music: Curves Ahead by Donn Wilkerson [BMI] and Genetic Analyzer by Le Fat Club [SACEM]Complete transcript available.](/vis/a010000/a013700/a013722/Sea_Ice_Thumbnail.jpg)
Release date
This page was originally published on Monday, September 21, 2020.
This page was last updated on Monday, January 6, 2025 at 12:18 AM EST.