MAVEN Observes Solar Particle Velocities and the Induced Magnetic Field
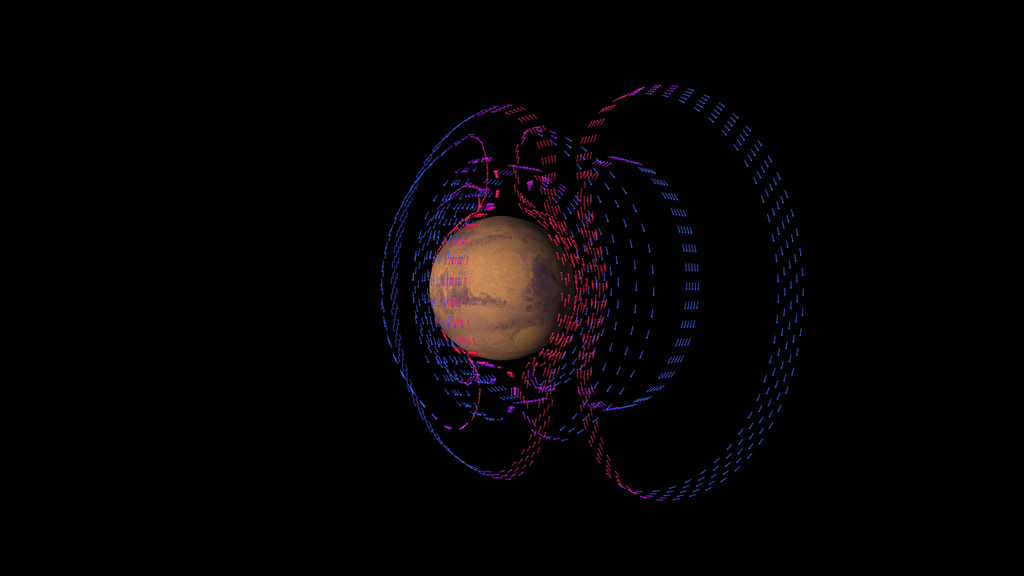
MAVEN orbits Mars and measures solar particle velocities and variations in the solar wind’s magnetic field.
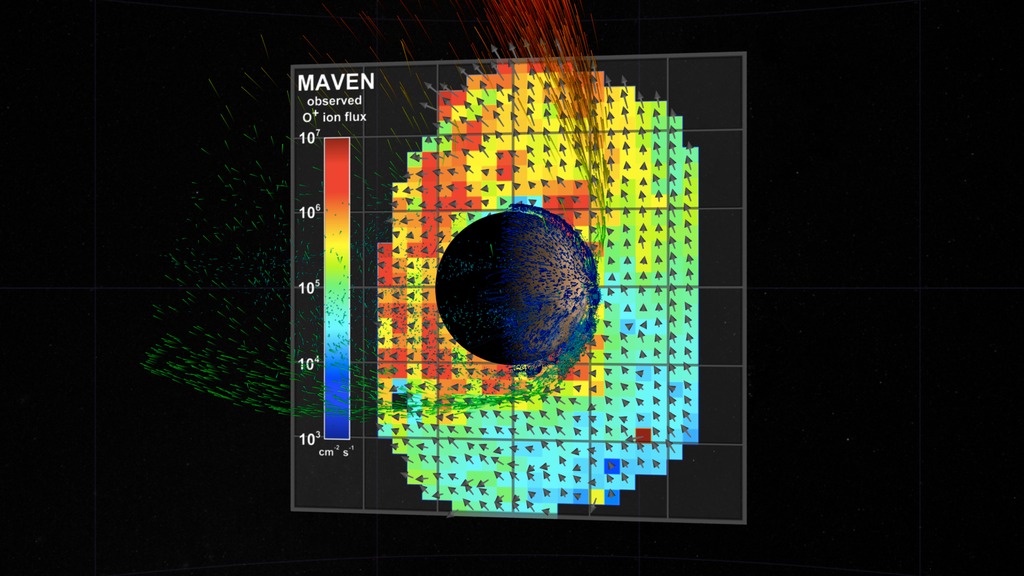
The Mars Atmosphere and Volatile Evolution (MAVEN) spacecraft has been orbiting Mars since 2014, observing the planet’s upper atmosphere and its interaction with the solar wind in order to better understand the climate history of Mars.
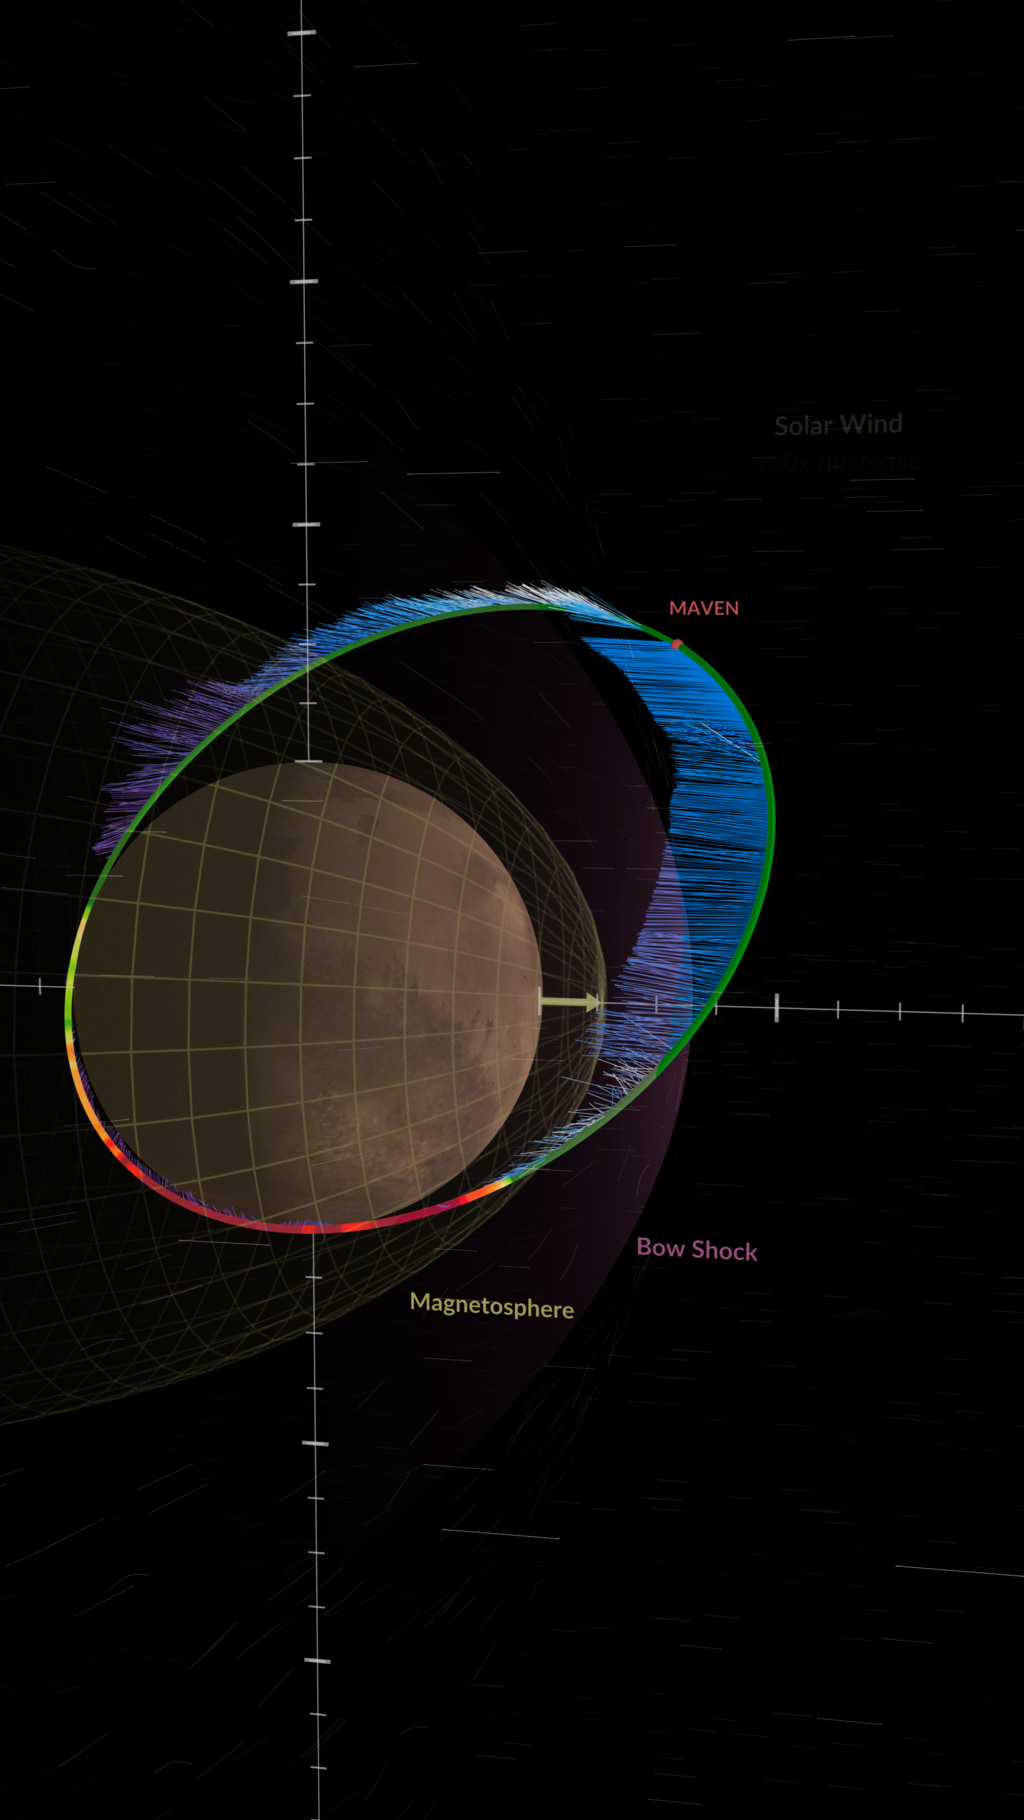
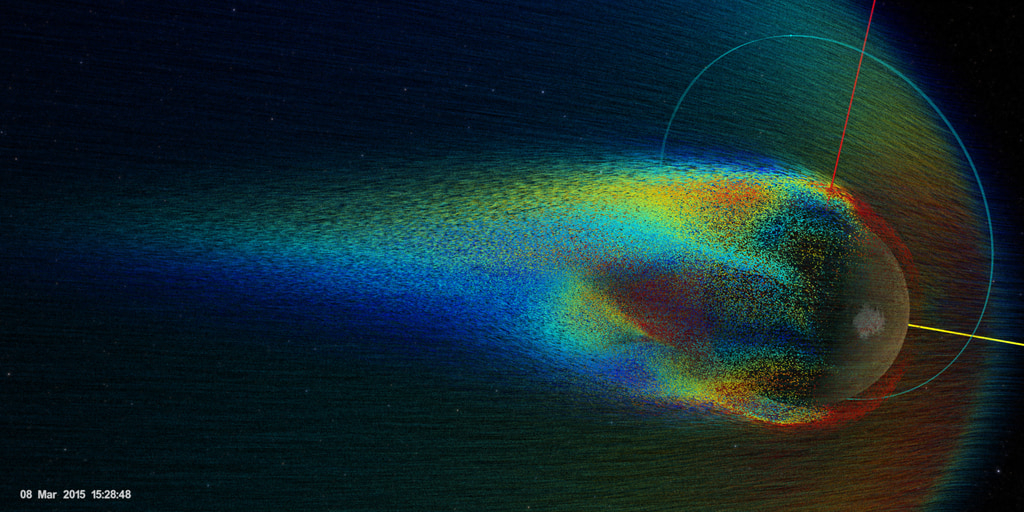
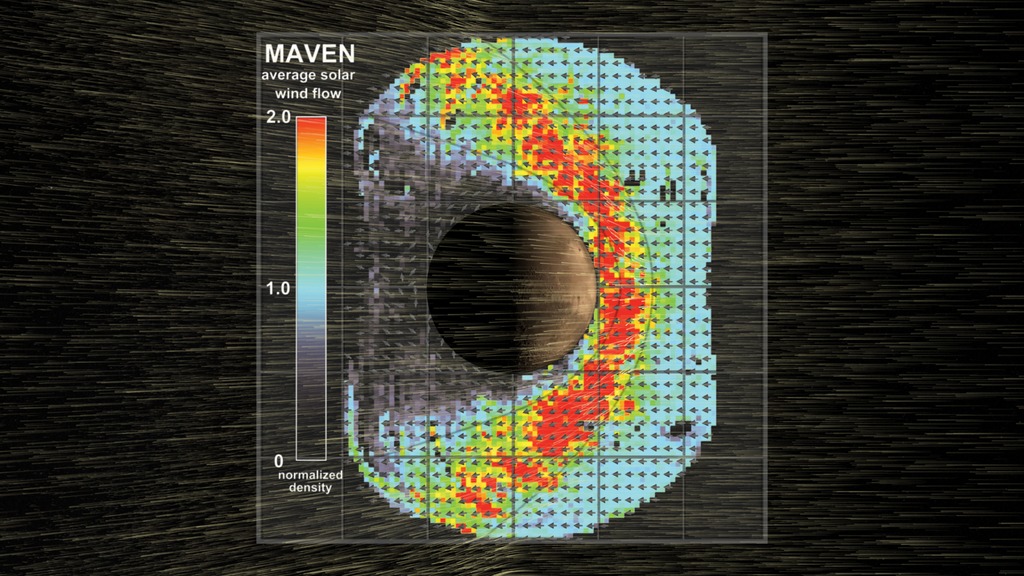
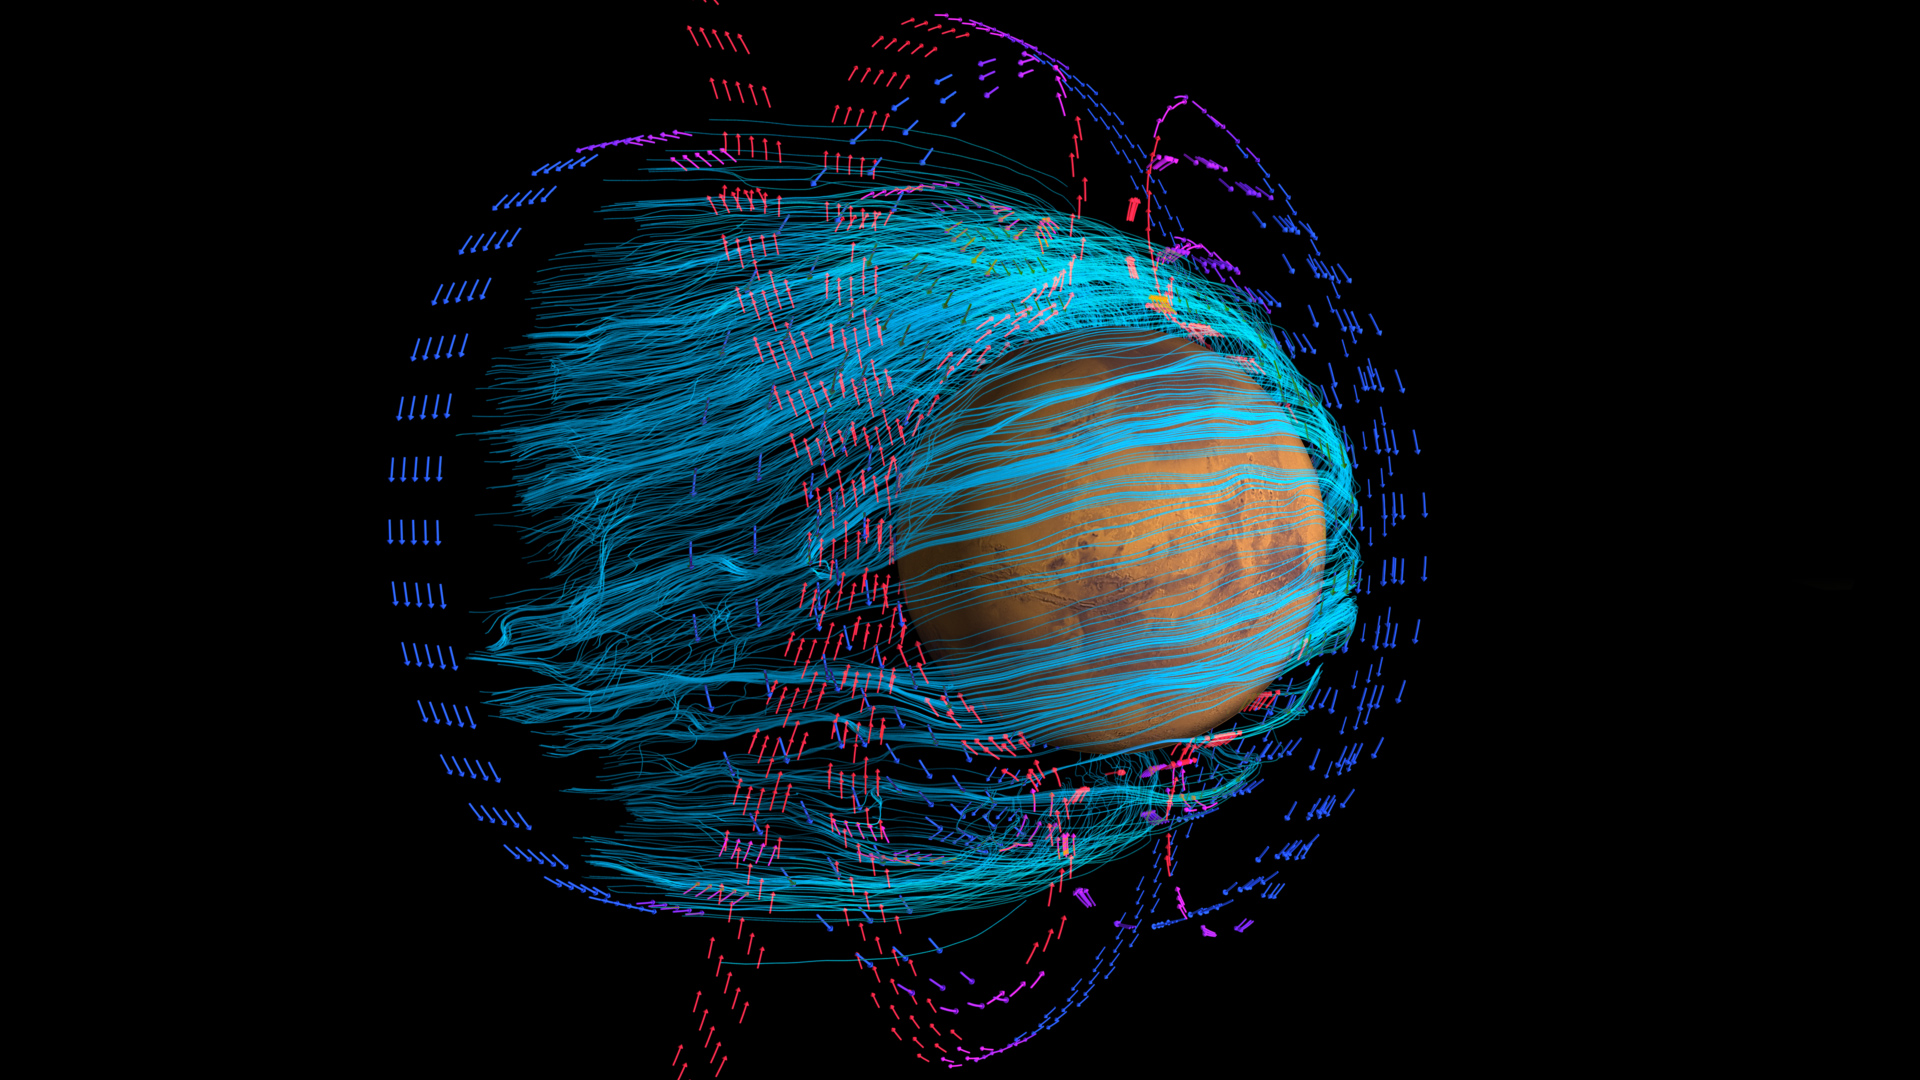
In this visualization, a series of MAVEN’s orbits are shown from March 8-9, 2015. During these orbits, MAVEN’s particles and fields instruments observed the speed and direction of charged particles in the solar wind flowing past Mars – represented as yellow spikes pointing from the planet’s dayside toward its nightside. MAVEN’s magnetometers also recorded variations in the strength and direction of the solar wind’s magnetic field – represented as green spikes at an angle to the charged particle velocities.
The solar wind has contributed to the erosion of the Martian atmosphere over time, which has gradually turned Mars from warm and wet to cold and dry. MAVEN is helping scientists to better understand the complex processes that have driven this transition, and which continue to affect the Martian climate today.
For More Information
See NASA.gov
Credits
Please give credit for this item to:
NASA's Scientific Visualization Studio
-
Visualizers
-
Greg Shirah
(NASA/GSFC)

- Horace Mitchell (NASA/GSFC)
-
Greg Shirah
(NASA/GSFC)
-
Producer
- Dan Gallagher (USRA)
-
Scientist
- David Brain (University of Colorado Boulder)
-
Technical support
- Laurence Schuler (ADNET Systems, Inc.)
- Ian Jones (ADNET Systems, Inc.)
Missions
This page is related to the following missions:Datasets used
-
[MGS: MOC]
ID: 58 -
CelesTrak Spacecraft Orbit Ephemeris
ID: 454This dataset can be found at: http://celestrak.com
See all pages that use this dataset -
Tycho Catalogue (Tycho 2 Catalogue) [Hipparcos: Telescope]
ID: 550This dataset can be found at: http://archive.eso.org/ASTROM/
See all pages that use this dataset -
Magnetic Field Vectors [MAVEN: MAG]
ID: 1082
Note: While we identify the data sets used on this page, we do not store any further details, nor the data sets themselves on our site.
Related
- ID: 5200
 Visualization
 - ID: 4730
 Visualization
 - ID: 4825
 Visualization
 - ID: 4370
 Visualization
 - ID: 4393
 Visualization
Used as a Source In
- ID: 14477
![Learn about the “disappearance” of the solar wind at Mars that was witnessed by MAVEN – an event last seen nearly a quarter-century ago at Earth.Complete transcript available.Universal Production Music: “Space Museum” by Harry Gregson Williams [BMI], Atmosphere Music Ltd. [PRS]; “Currents and Crime Scenes” by Dylan Matthew Love and Harry Gregson Williams [BMI], Atmosphere Music Ltd. [PRS]Watch this video on the NASA Goddard YouTube channel.](/vis/a010000/a014400/a014477/MAVEN_Solar_Wind_Disappear_V4.jpg) Produced Video
Produced Video - ID: 13625
 Produced Video
Release date
This page was originally published on Monday, May 25, 2020.
This page was last updated on Monday, January 6, 2025 at 12:18 AM EST.