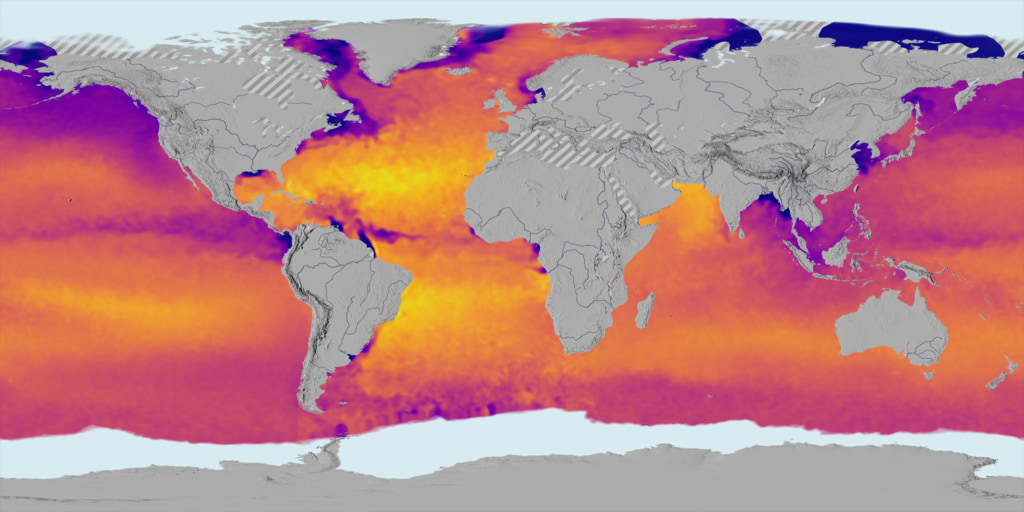
Earth Day 2020: Sea Surface Salinity (SSS) from August 2011 through July 2014
Sea Surface Salinity
This visualization shows sea surface salinity (SSS) data of the oceans from August 2011 through July 2014. The data set used is from the Aquarius satellite. Aquarius is a collaboration between NASA and the Space Agency of Argentina to measure global sea surface salinity (the amount of dissolved salts in water). Measuring salinity can help us better understand the water cycle and can also lead to improved climate models.
This visualization was created in part to support Earth Day 2020 media releases.
Credits
Please give credit for this item to:
NASA's Scientific Visualization Studio
-
Visualizers
-
Greg Shirah
(NASA/GSFC)

- Horace Mitchell (NASA/GSFC)
-
Greg Shirah
(NASA/GSFC)
-
Producer
- Ryan Fitzgibbons (USRA)
Series
This page can be found in the following series:Datasets used
-
MUR SST (Multi-scale Ultra-high Resolution (MUR) Sea Surface Temperature (SST) Analysis)
ID: 845
Note: While we identify the data sets used on this page, we do not store any further details, nor the data sets themselves on our site.
Related
- ID: 5017
 Visualization
Used as a Source In
- ID: 13586
 Produced Video
Release date
This page was originally published on Wednesday, April 15, 2020.
This page was last updated on Monday, January 6, 2025 at 12:18 AM EST.