GPM observes Cyclone Harold in the South Pacific
View of 3D precipitation from DPR and surface rain rates (mm/hr) from GMI of Cyclone Harold in the South Pacific on April 6 2020. The camera pushes in as a cutting plan reveals the inner precipitation rates of the storm.
This video is also available on our YouTube channel.
A Category 4 cyclone, the most powerful yet of 2020, made landfall on the South Pacific nation of Vanuatu on Monday, not long before this GPM overpass. Tropical Cyclone Harold developed from a low pressure system that was observed to the east of Papua New Guinea last week, and has tracked to the southeast, where it has already caused flooding and loss of life in the Solomon Islands. Early reports from Vanuatu indicate heavy flooding and property damage. Harold is forecast to continue to Fiji later this week.
GPM data is archived at https://pps.gsfc.nasa.gov/
. Shades of green represent low amounts of liquid precipitation, whereas shades of red represent high amounts of precipitation.")
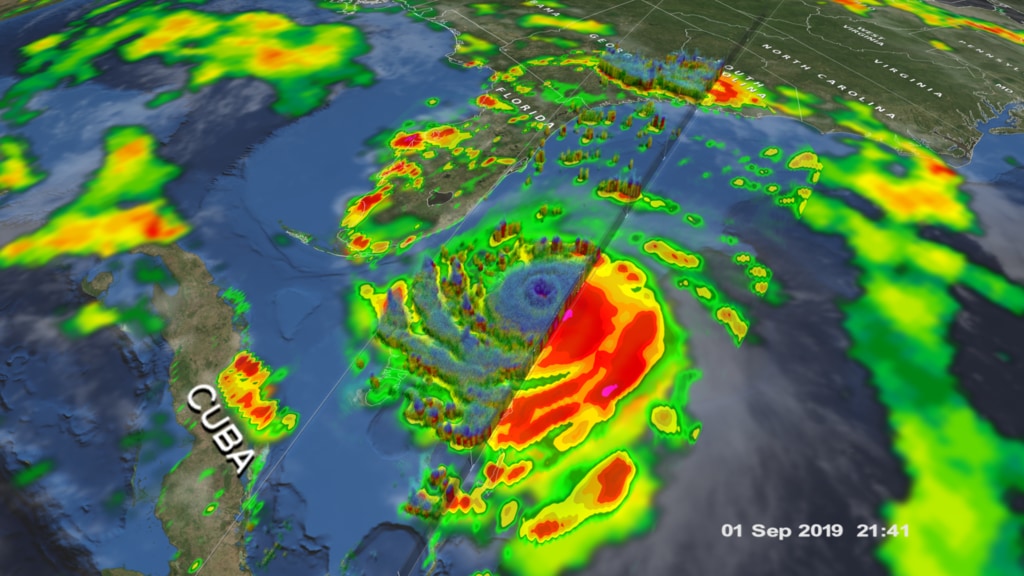
Color bar for liquid precipitation rates (ie, rain rates). Shades of green represent low amounts of liquid precipitation, whereas shades of red represent high amounts of precipitation.
Color bar for frozen precipitation rates (ie, snow rates). Shades of cyan represent low amounts of frozen precipitation, whereas shades of purple represent high amounts of precipitation.
Credits
Please give credit for this item to:
NASA's Scientific Visualization Studio
-
Data visualizers
-
Greg Shirah
(NASA/GSFC)

-
Kel Elkins
(USRA)
-
Alex Kekesi
(Global Science and Technology, Inc.)
-
Greg Shirah
(NASA/GSFC)
-
Scientists
-
George Huffman
(NASA/GSFC)
- Dalia B Kirschbaum (NASA/GSFC)
- Gail Skofronick Jackson (NASA/GSFC)
- Scott Braun (NASA/GSFC)
-
George Huffman
(NASA/GSFC)
-
Writer
- Stephen Lang (SSAI)
-
Producer
- Ryan Fitzgibbons (USRA)
Missions
This page is related to the following missions:Series
This page can be found in the following series:Datasets used
-
Rain Rates (Surface Precipitation) [GPM: GMI]
ID: 822Credit: Data provided by the joint NASA/JAXA GPM mission.
See all pages that use this dataset -
Volumetric Precipitation data (Ku) [GPM: DPR]
ID: 830Credit: Data provided by the joint NASA/JAXA GPM mission.
See all pages that use this dataset -
IMERG
ID: 863This dataset can be found at: http://pmm.nasa.gov/sites/default/files/document_files/IMERG_ATBD_V4.4.pdf
See all pages that use this dataset
Note: While we identify the data sets used on this page, we do not store any further details, nor the data sets themselves on our site.
Related
- ID: 4751
 Visualization
Release date
This page was originally published on Thursday, April 9, 2020.
This page was last updated on Monday, January 6, 2025 at 12:17 AM EST.