Reductions in Pollution Associated with Decreased Fossil Fuel Use Resulting from COVID-19 Mitigation
Over the past several weeks, the United States has seen significant reductions in air pollution over its major metropolitan areas. Similar reductions in air pollution have been observed in other regions of the world.
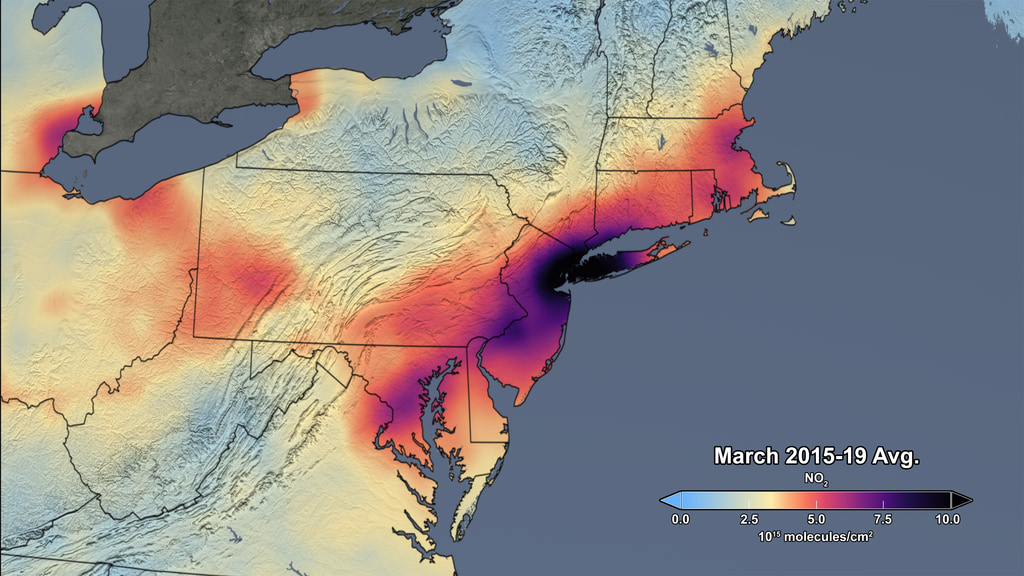
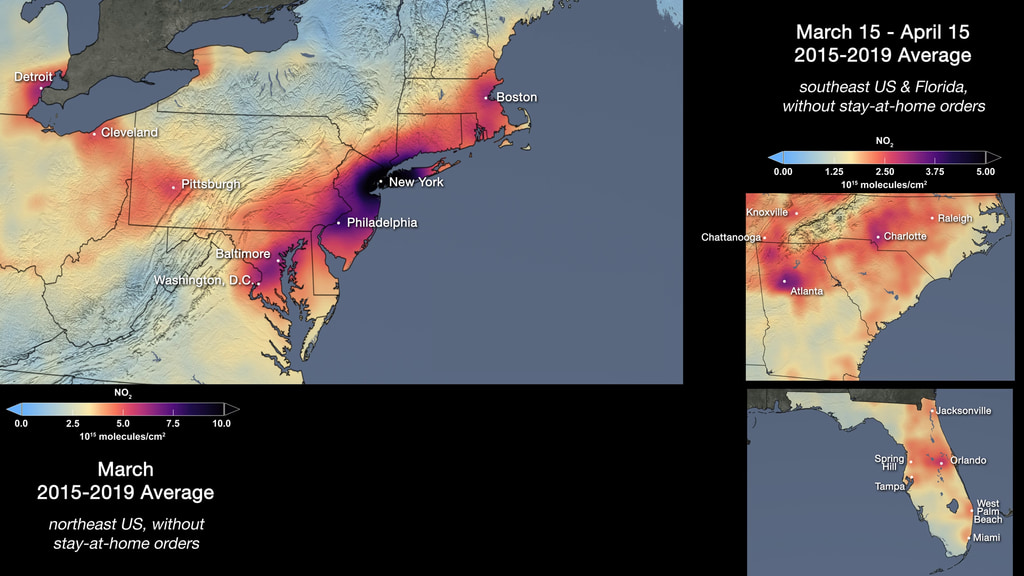
These recent improvements in air quality have come at a high cost, as communities grapple with widespread lockdowns and shelter-in-place orders as a result of the spread of COVID-19. One air pollutant, nitrogen dioxide (NO2), is primarily emitted from burning fossil fuels (diesel, gasoline, coal), coming out of our tailpipes when driving cars and smokestacks when generating electricity. Therefore, changes in NO2 levels can be used as an indicator of changes in human activity. However, care must be taken when processing and interpreting satellite NO2 data as the quantity observed by the satellite is not exactly the same as the NO2 abundance at ground level. NO2 levels are influenced by dynamical and chemical processes in the atmosphere. For instance, atmospheric NO2 levels can vary day-to-day due to changes in the weather, which influences both the lifetime of NO2 molecules as well as the dispersal of the molecules by the wind. It is also important to note that satellites that observe NO2 cannot see through clouds, so all data shown is for days with low amounts of cloudiness. If processed and interpreted carefully, NO2 levels observed from space serve as an effective proxy for NO2 levels at Earth's surface.
NASA's air quality group is also monitoring other air pollutants, such as sulfur dioxide (SO2). Major anthropogenic activities that emit SO2 include electricity generation, oil and gas extraction, and metal smelting. SO2 is emitted during electricity generation if the coal burned has sulfur impurities that are not removed (or not “scrubbed”) from the plant’s exhaust stacks.
For more information on what pollutants NASA satellites observe, visit the NASA Air Quality website.

Tropospheric NO2 Column, March 2015-2019 Average, Northeast USA, With Labels
Tropospheric NO2 Column, March 2020, Northeast USA, With Labels
Tropospheric NO2 Column, March 2015-2019 Average, Northeast USA, No Labels
Tropospheric NO2 Column, March 2020, Northeast USA, No Labels
Tropospheric NO2 Column Animation, With Total Mass Inset
Colorbar, Quantitative
Colorbar, Qualitative
Animated Gif -tropospheric NO2 from March 15-April 15 time series in southeastern US.
Tropospheric NO2 Column, March 15-April 15 2015-2019 Average, Southeast USA, With Cities
Tropospheric NO2 Column, March 15-April 15 2020 Average, Southeast USA, With Cities
Tropospheric NO2 Column, March 15-April 15 2015-2019 Average, Southeast USA, No Cities
Tropospheric NO2 Column, March 15-April 15 2020 Average, Southeast USA, No Cities
Tropospheric NO2 Column, March 15-April 15 2015-2019 Average, Southeast USA, No Labels
Tropospheric NO2 Column, March 15-April 15 2020 Average, Southeast USA, No Labels
Animated Gif -tropospheric NO2 from March 15-April 15 time series in the state of Florida
Tropospheric NO2 Column, March 15-April 15 2015-2019 Average, Florida, With Cities
Tropospheric NO2 Column, March 15-April 15 2020 Average, Florida, With Cities
Tropospheric NO2 Column, March 15-April 15 2015-2019 Average, Florida, No Cities
Tropospheric NO2 Column, March 15-April 15 2020 Average, Florida, No Cities
Tropospheric NO2 Column, March 15-April 15 2015-2019 Average, Florida, No Labels
Tropospheric NO2 Column, March 15-April 15 2020 Average, Florida, No Labels
Colorbar, Range 0-5 x10^15 molecules/cm^2
Animated Gif of tropospheric NO2, March 25 -April 25 of Indian subcontinent.
On March 24, 2020, Prime Minister Modi ordered a nationwide stay-at-home order for India’s 1.3 billion citizens in an attempt to slow the spread of COVID-19.
Tropospheric NO2 Column, March 25-April 25 2017-2019 Average, Indian Subcontinent, With Labels
Tropospheric NO2 Column, March 25-April 25 2020 Average, Indian Subcontinent, With Labels
Tropospheric NO2 Column, March 25-April 25 2017-2019 Average, Indian Subcontinent, No Labels
Tropospheric NO2 Column, March 25-April 25 2020 Average, Indian Subcontinent, No Labels
Animated Gif - Tropospheric SO2 Column, March 25-April 25 time series of Indian Subcontinent. On March 24, 2020, Prime Minister Modi ordered a nationwide stay-at-home order for India’s 1.3 billion citizens in an attempt to slow the spread of COVID-19.
Tropospheric SO2 Column, March 25-April 25 2017-2019 Average, Indian Subcontinent, With Labels
Tropospheric SO2 Column, March 25-April 25 2020 Average, Indian Subcontinent, With Labels. On March 24, 2020, Prime Minister Modi ordered a nationwide stay-at-home order for India’s 1.3 billion citizens in an attempt to slow the spread of COVID-19. As a consequence, less fossil fuels are being consumed and, subsequently, there is less air pollution in India and in neighboring countries, including Pakistan, Nepal, Bangladesh, and Sri Lanka.
Colorbar, Range 0-1 Dobson Units
Animated Gif -tropospheric NO2 from March 25-April 25 time series in southwestern US.
Tropospheric NO2 Column, March 25-April 25 2015-2019 Average, Southwest USA, With Labels
Tropospheric NO2 Column, March 25-April 25 2020 Average, Southwest USA, With Labels
Tropospheric NO2 Column, March 25-April 25 2015-2019 Average, Southwest USA, No Labels
Tropospheric NO2 Column, March 25-April 25 2020 Average, Southwest USA, No Labels
Colorbar, Range 0-12 x10^15 molecules/cm^2
Credits
Please give credit for this item to:
NASA's Scientific Visualization Studio
-
Visualizer
- Trent L. Schindler (USRA)
-
Scientists
- Bryan Duncan (NASA/GSFC)
- Joanna Joiner (NASA/GSFC)
- Lok Lamsal (USRA)
-
Writer
- Bryan Duncan (NASA/GSFC)
-
Technical support
- Ian Jones (ADNET Systems, Inc.)
- Laurence Schuler (ADNET Systems, Inc.)
Datasets used
-
[Aura: OMI]
ID: 147 -
Ozone [Aura: OMI]
ID: 264 -
BMNG (Blue Marble: Next Generation) [Terra and Aqua: MODIS]
ID: 508Credit: The Blue Marble data is courtesy of Reto Stockli (NASA/GSFC).
This dataset can be found at: http://earthobservatory.nasa.gov/Newsroom/BlueMarble/
See all pages that use this dataset
Note: While we identify the data sets used on this page, we do not store any further details, nor the data sets themselves on our site.
Related
- ID: 31225
 Hyperwall Visual
 - ID: 4912

Used as a Source In
- ID: 13814
 Produced Video
 - ID: 13753
 Produced Video
 - ID: 31142
 Hyperwall Visual
Release date
This page was originally published on Friday, April 24, 2020.
This page was last updated on Sunday, January 19, 2025 at 10:42 PM EST.