Measuring Sea Ice Thickness with ICESat-2
This visualization depicts sea ice thickness in the Arctic Ocean as measured by ICESat-2 over the course of several months. The visualization begins with a global view of the north pole as individual tracks are drawn over time representing each time the satellite passes overhead and collects sea ice data. A closeup view of one track is revealed, showing how the ICESat-2 laser can measure ice freeboard (height above sea level), which can be used to calculate total ice thickness. The visualization concludes by showing monthly average of sea ice thickness from November 2018 to March 2019.
One of the big challenges in polar science is measuring the thickness of the floating sea ice that blankets the Arctic and Southern Oceans. Newly formed sea ice might be only a few inches thick, whereas sea ice that survives several winter seasons can grow to several feet in thickness (over ten feet in some places).
Sea ice thickness is typically estimated by first measuring sea ice freeboard - how much of the floating ice can be observed above sea level. Sea ice floats slightly above sea level because it is less dense than water.
NASA’s ICESat-2 satellite measures the Earth’s surface height by firing green laser pulses towards Earth and timing how long it takes for those laser pulses to reflect back to the satellite. Ice freeboard is calculated by differencing the heights of the ice surface and areas of open water next to the ice. Additional information including the depth and density of the snow layer on top of the ice is needed to convert this freeboard measurement to sea ice thickness. New state-of-the-art snow accumulation models have been developed to provide this extra data in preparation for the launch of ICESat-2.
The very high precision of the ICESat-2 laser has enabled us for to measure the thickness of very thin sea ice for the first time. As the Arctic warms rapidly it is becoming increasingly dominated by a younger and thinner ice cover, making these new measurements extremely invaluable for understanding our changing polar regions.
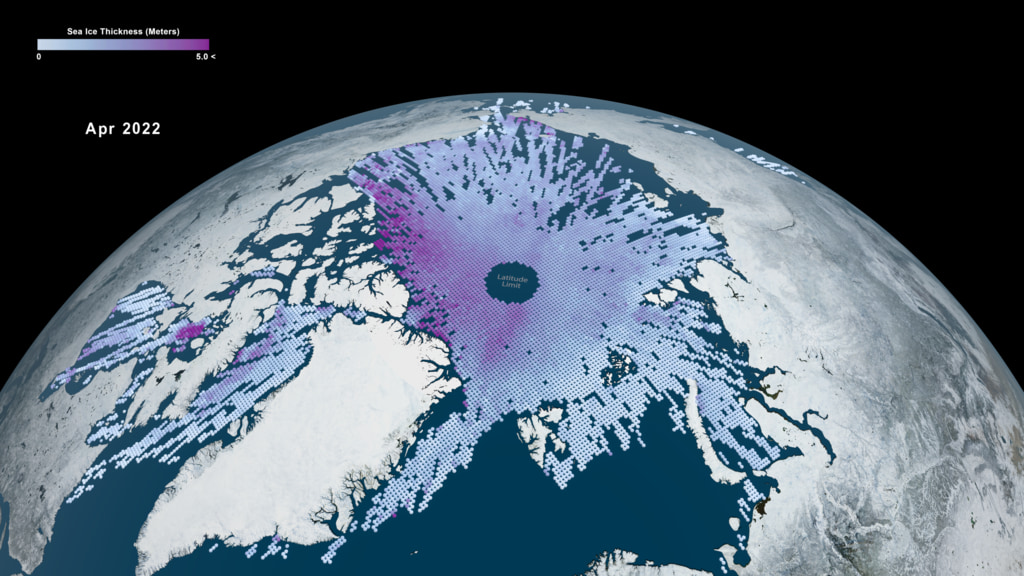
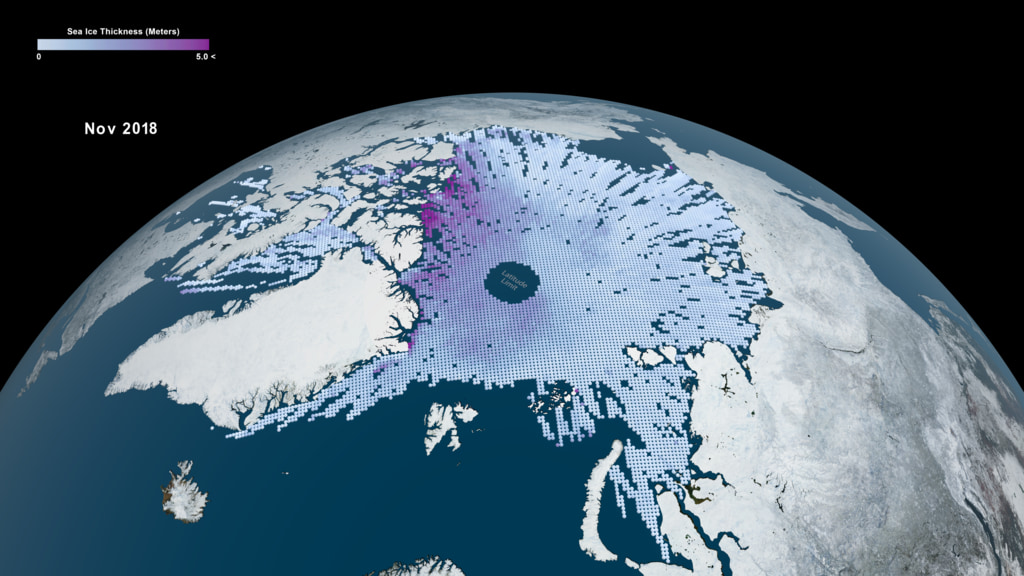
ICESat-2 tracks over the Arctic Ocean spanning from November 2018 to March 2019.
A view of the Arctic Ocean with monthly average sea ice thickness spanning November 2018 to March 2019. Low values are depicted in light blue, and higher values (5 meters) are depicted in magenta.
Close up view of a single ICESat-2 track. The light grey section of the track represented ice freeboard (height above sea level) and the darker grey represents sea ice below the ocean surface. A 10m orange line is shown for scale.
Credits
Please give credit for this item to:
NASA's Scientific Visualization Studio
-
Visualizer
-
Kel Elkins
(USRA)

-
Kel Elkins
(USRA)
-
Producer
- Ryan Fitzgibbons (USRA)
-
Scientists
- Alek A. Petty (University of Maryland)
- Thomas A. Neumann (NASA/GSFC)
- Nathan T. Kurtz (NASA/GSFC)
Series
This page can be found in the following series:Datasets used
-
Sea Ice Freeboard [ICESat-2: Advanced Topographic Laser Altimeter System (ATLAS)]
ID: 1056This dataset can be found at: https://nsidc.org/data/atl20/versions/5
See all pages that use this dataset
Note: While we identify the data sets used on this page, we do not store any further details, nor the data sets themselves on our site.
Related
- ID: 5100
 Visualization
 - ID: 4988
 Visualization
 - ID: 13300
 Produced Video
Used as a Source In
- ID: 14261
 Produced Video
 - ID: 13525
 Produced Video
Release date
This page was originally published on Friday, September 6, 2019.
This page was last updated on Monday, June 23, 2025 at 12:09 AM EDT.