Geothermal Heat Flux Reveals the Iceland Hotspot Track underneath Greenland
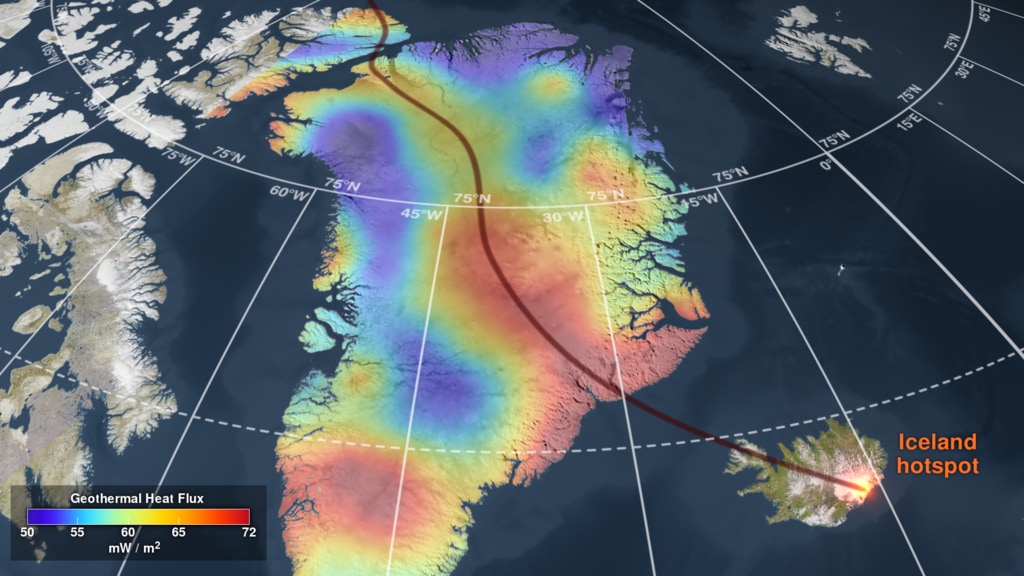
This visualization shows the Greenland geothermal heat flux map, the track of the Iceland hotspot through Greenland, and the plate tectonic motion of Greenland over the hotspot during the past 100 million years.
This video is also on the NASA YouTube channel.
Geothermal heat flux (GHF) is the amount of heat flowing outward from the interior of the Earth as measured at different points on the surface. GHF can play an important role in the motion of glaciers in places like Greenland, but the ice can also make GHF difficult to measure directly. The ice sheet covering Greenland is up to three kilometers thick, so GHF there has been measured in only a few places where deep boreholes have been drilled through the ice.
In a paper published in Geophysical Research Letters, NASA Goddard research scientist Yasmina Martos and her coauthors describe a method of mapping GHF across Greenland using a map of magnetic anomaly, the local variations in the Earth's magnetic field. Temperature affects the magnetic record stored in minerals in the Earth's crust, and using this fact, Martos et al. were able to infer a high-resolution map of GHF for Greenland and neighboring Ellesmere Island. Crustal thickness data derived from gravity measurements supports the conclusions.
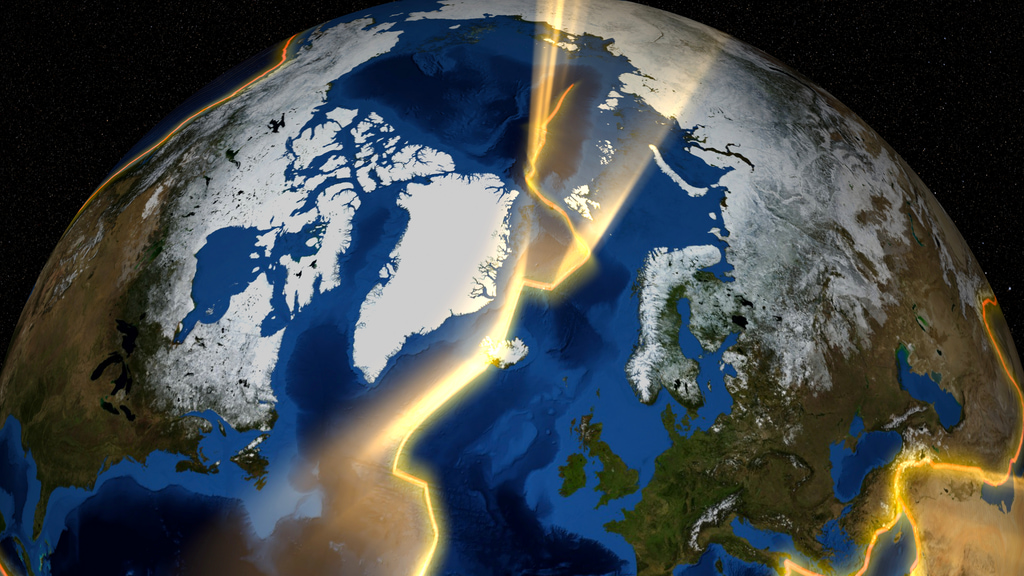
The GHF map contains at least two surprises. The overall GHF is lower than expected, and the map reveals a warm swath across Greenland from the northwest to the southeast. The swath is likely to be the track of the Iceland hotspot, a plume of magma rising from deep within the Earth's mantle. The hotspot is responsible for the formation of Iceland, beginning roughly 20 million years ago, in a manner similar to the formation of the Hawaiian islands. The track of the hotspot through Greenland actually records the motion of Greenland over the last 100 million years as plate tectonics moved it north and west.
This visualization shows the GHF map, the hotspot track, and the motion of Greenland.
For More Information
Credits
Please give credit for this item to:
NASA's Scientific Visualization Studio
-
Visualizer
-
Ernie Wright
(USRA)

-
Ernie Wright
(USRA)
-
Technical support
- Laurence Schuler (ADNET Systems, Inc.)
- Ian Jones (ADNET Systems, Inc.)
-
Scientist
- Yasmina Martos (University of Maryland College Park)
-
Producers
- Dan Gallagher (USRA)
- Jefferson Beck (USRA)
- Lonnie Shekhtman (ADNET Systems, Inc.)
Datasets used
-
BMNG (Blue Marble: Next Generation) [Terra and Aqua: MODIS]
ID: 508Credit: The Blue Marble data is courtesy of Reto Stockli (NASA/GSFC).
This dataset can be found at: http://earthobservatory.nasa.gov/Newsroom/BlueMarble/
See all pages that use this dataset -
Greenland Geothermal Heat Flux
ID: 1012Credit: Martos et al. 2018
See all pages that use this dataset
Note: While we identify the data sets used on this page, we do not store any further details, nor the data sets themselves on our site.
Related
- ID: 13128
 Produced Video
Used as a Source In
- ID: 13025
 Produced Video
Release date
This page was originally published on Wednesday, August 1, 2018.
This page was last updated on Monday, January 6, 2025 at 12:13 AM EST.