Brazilian Rainforest Logged Area Canopy Change 2013-2016
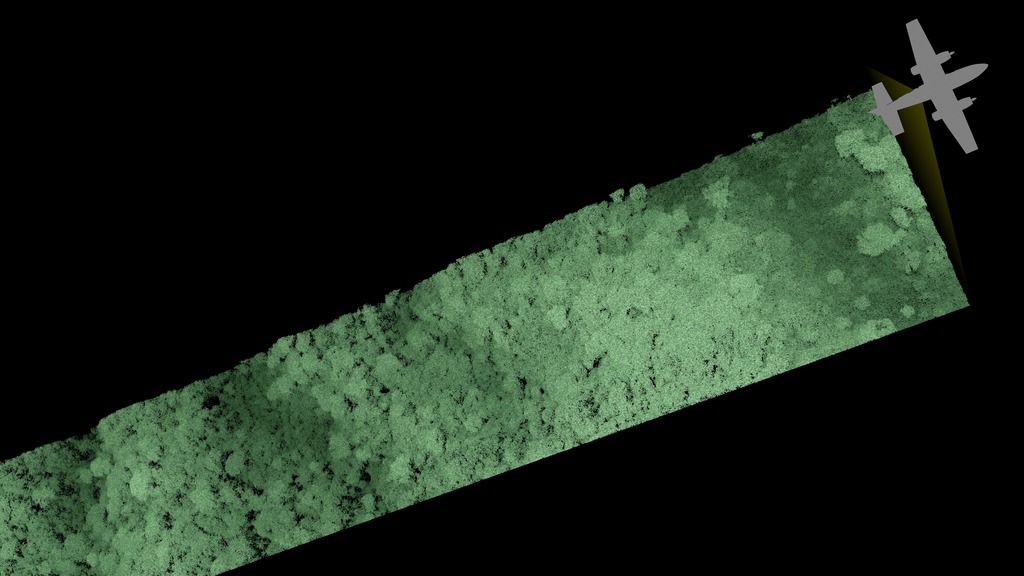
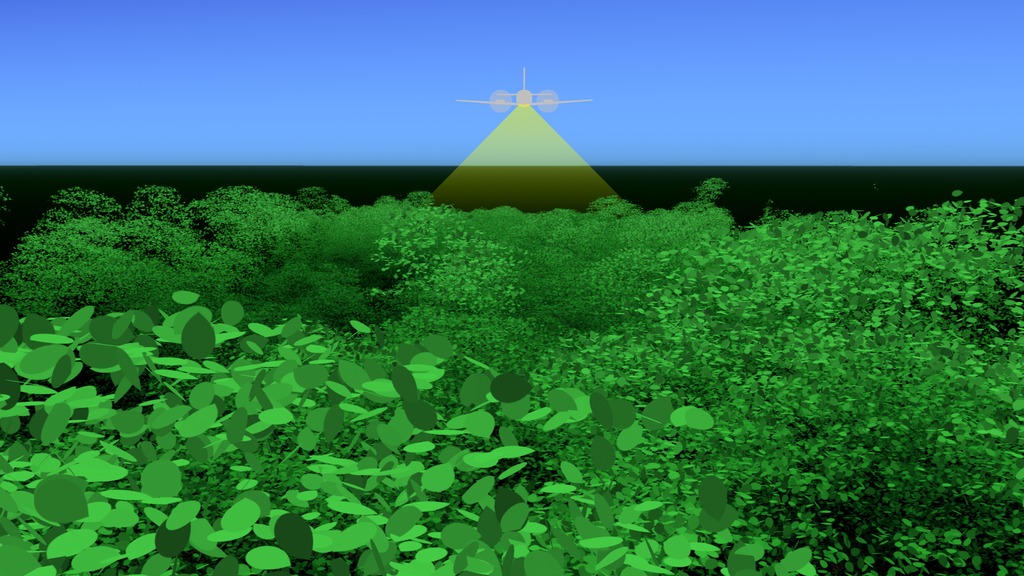
This data visualization starts with an airplane collecting lidar over a flat plane. As the data is collected a strip of the 2013 Brazilian rainforest canopy can be seen. Once the plane flies past, we spin the camera around to get a better view of the treetop canopy data. We then highlight areas of the canopy that will undergo significant change from 2013 to 2016. Finally, we allow those highlighted areas (ie, trees and tree branches) to fall the the ground, revealing the new 2016 forest canopy.
This visualization shows LIDAR (LIght Detection And Ranging) canopy data over the Brazilian Rainforest and how successive passes between 2013 to 2016 show changes to the treetop canopies. In this particular case, the area of interest appears to have been logged due to the very high number of downed trees. Together these data points provide scientists with information on foliage distribution and the elements of tree canopy. Similar LIDAR technologies are used to measure terrain topographies on the Moon and Mars.

Print resolution image of the 2013 Brazilian Forest Canopy with change areas highlighted.
Print resolution image of the 2016 forest canopy.
Credits
Please give credit for this item to:
NASA's Scientific Visualization Studio
-
Data visualizers
-
Alex Kekesi
(Global Science and Technology, Inc.)

-
Greg Shirah
(NASA/GSFC)
- Horace Mitchell (NASA/GSFC)
-
Cindy Starr
(Global Science and Technology, Inc.)
-
Alex Kekesi
(Global Science and Technology, Inc.)
-
Scientists
-
Doug C. Morton
(NASA/GSFC)
- Veronika Leitold (University of Maryland)
-
Doug C. Morton
(NASA/GSFC)
-
Technical support
- Laurence Schuler (ADNET Systems, Inc.)
- Ian Jones (ADNET Systems, Inc.)
-
Data provider
- Hyeungu Choi (Global Science and Technology, Inc.)
Series
This page can be found in the following series:Related papers
https://nph.onlinelibrary.wiley.com/doi/10.1111/nph.15110
https://nph.onlinelibrary.wiley.com/doi/10.1111/nph.15110
Datasets used
-
LiDAR (LiDAR 3D point cloud) [Airplane: G-LiHT]
ID: 965
Note: While we identify the data sets used on this page, we do not store any further details, nor the data sets themselves on our site.
Related
- ID: 4530
 Visualization
 - ID: 4532
 Visualization
 - ID: 4651
 Visualization
 - ID: 4652

Used as a Source In
- ID: 12982
 Produced Video
Release date
This page was originally published on Tuesday, June 12, 2018.
This page was last updated on Monday, January 6, 2025 at 12:12 AM EST.