Pulsar Current Sheets - Electron & Positron Flows
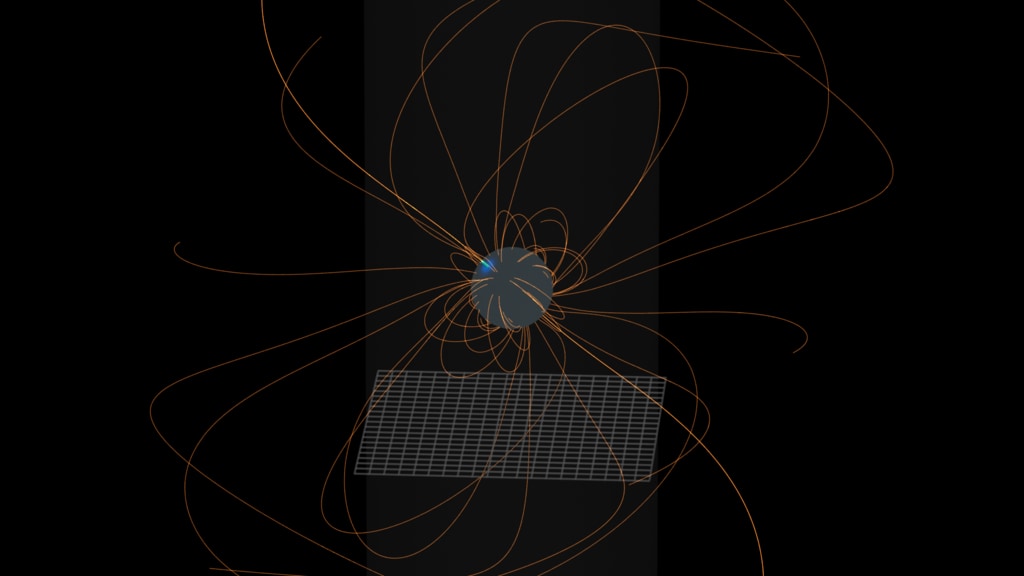
This movie presents a basic tour around the simulation magnetic field including motion of the high-energy electrons and positrons. This version is generated with some simple reference objects for more general use.
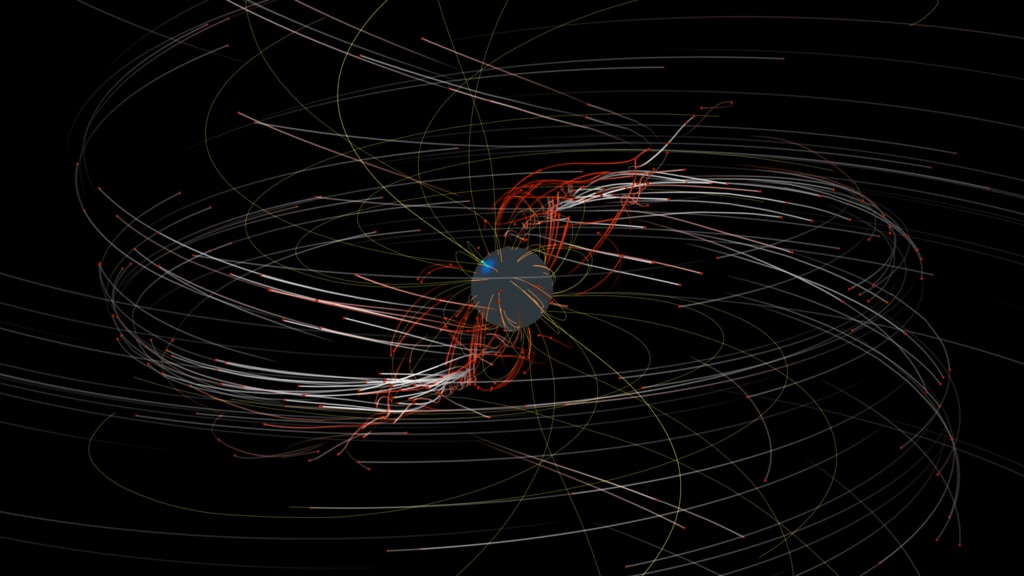
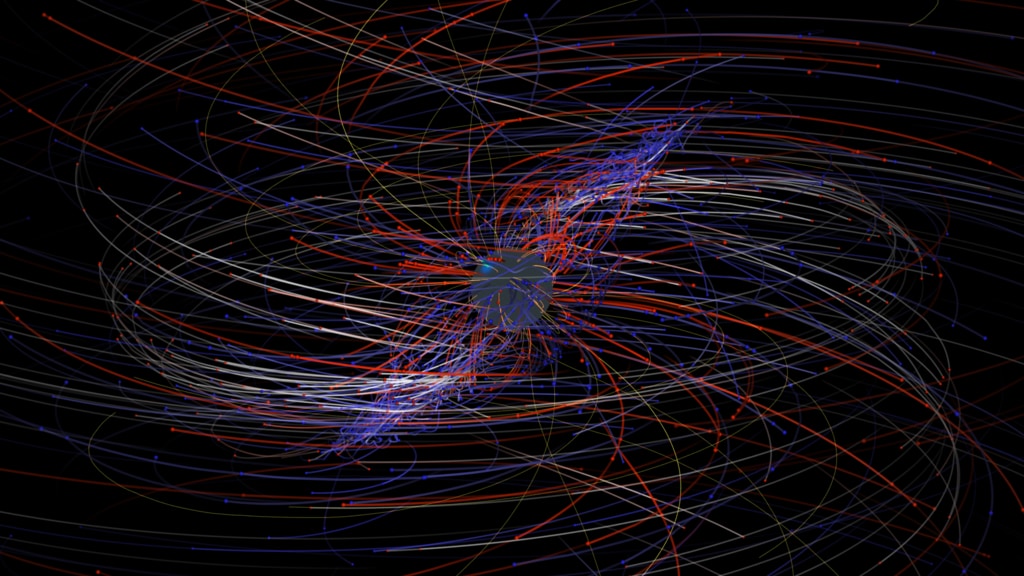
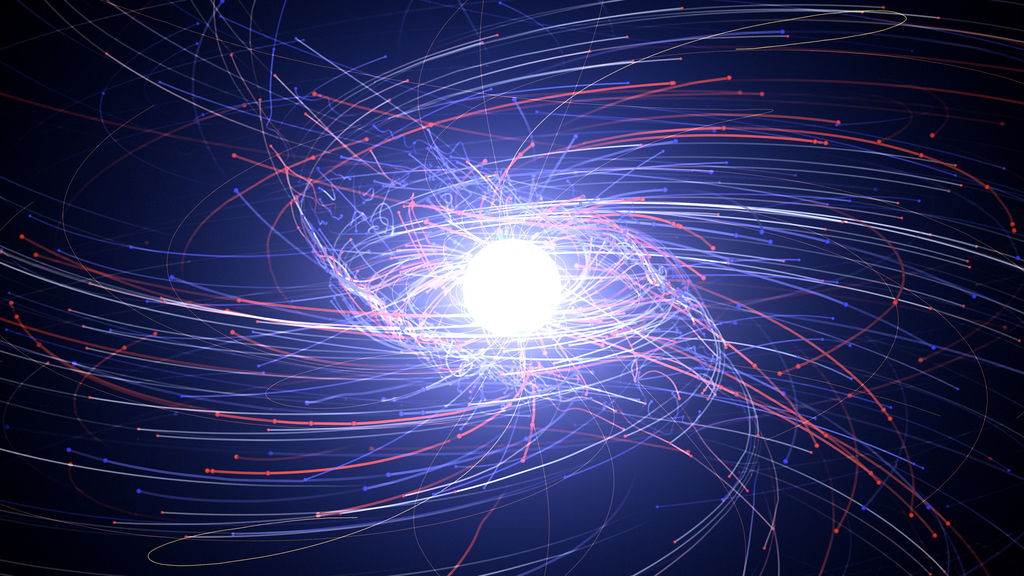
Scientists studying what amounts to a computer-simulated “pulsar in a box” are gaining a more detailed understanding of the complex, high-energy environment around spinning neutron stars, also called pulsars. The model traces the paths of charged particles in magnetic and electric fields near the neutron star, revealing behaviors that may help explain how pulsars emit gamma-ray and radio pulses with ultraprecise timing.
A pulsar is the crushed core of a massive star that exploded as a supernova. The core is so compressed that more mass than the Sun's squeezes into a ball no wider than Manhattan Island in New York City. This process also revvs up its rotation and strengthens its magnetic and electric fields.
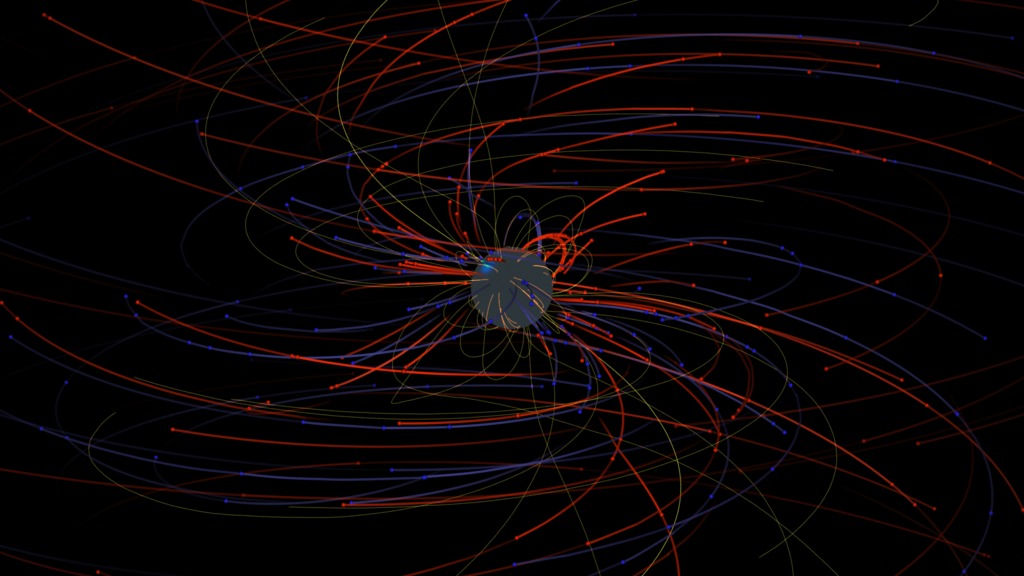
Various physical processes ensure that most of the particles around a pulsar are either electrons or their antimatter counterparts, positrons. To trace the behavior and energies of these particles, the researchers used a comparatively new type of pulsar model called a “particle in cell” (PIC) simulation.
The PIC technique lets scientists explore the pulsar from first principles, starting with a spinning, magnetized meutron star. The computer code injects electrons and positrons at the pulsar's surface and tracks how they interact with the electric and magnetic fields. It's computationally intensive because the particle motions affect the fields and the fields affect the particles, and everything is moving near the speed of light.
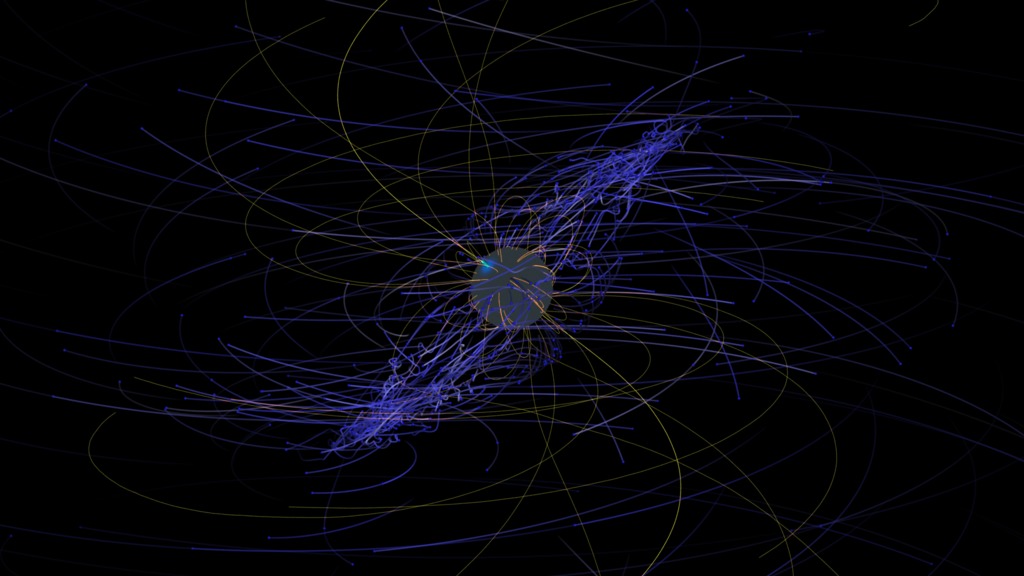
This visualization shows the high-speed electrons and positrons moviing around the pulsar. Darker blue trails represent slow electrons, darker red trails represent slow positrons. White trails indicate high speed (relativisitic) particles. Electrons and positrons can be accelerated near the edge of the current sheet.
This movie presents a tour from the inertial frame and spinning up to the co-rotating frame around the simulation magnetic field including motion of the high-energy electrons and positrons. This version is generated with some simple reference objects for more general use.
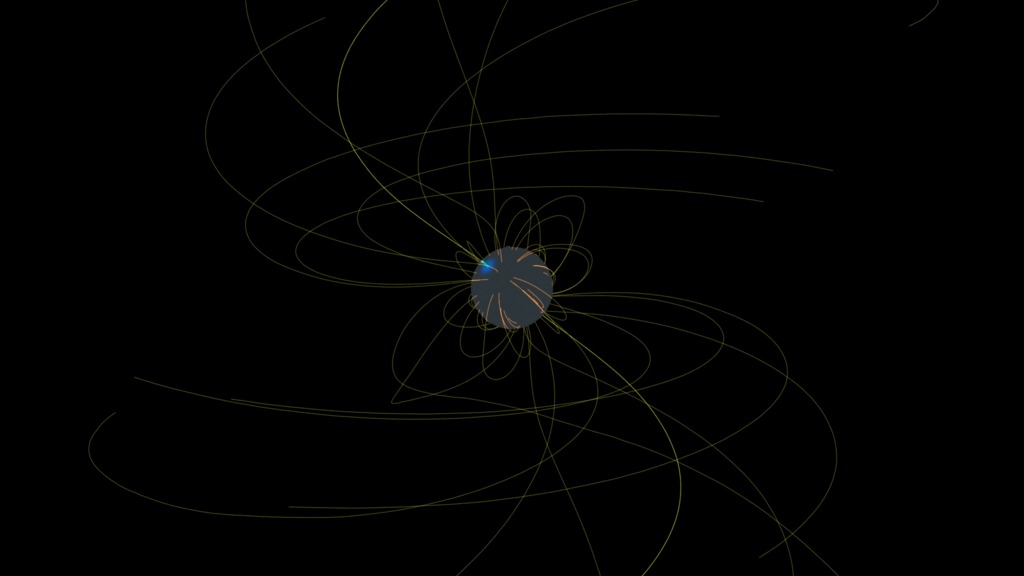
This movie presents a view of the simulation magnetic field including motion of the high-energy electrons and positrons, from above the rotation axis. This version is generated with some simple reference objects for more general use.
This movie presents a basic tour around the simulation magnetic field including motion of the high-energy electrons and positrons. This version is generated with no background objects and an alpha channel for custom compositing.
This movie presents a tour from the inertial frame and spinning up to the co-rotating frame around the simulation magnetic field including motion of the high-energy electrons and positrons. This version is generated with no background objects and an alpha channel for custom compositing.
This movie presents a view of the simulation magnetic field including motion of the high-energy electrons and positrons, from above the rotation axis. This version is generated with no background objects and an alpha channel for custom compositing.

Color bar for electrons representing the particle speed as the relativisitic Lorentz factor.
Color bar for positrons representing the particle speed as the relativisitic Lorentz factor.
Credits
Please give credit for this item to:
NASA's Scientific Visualization Studio
-
Data visualizer
- Tom Bridgman (Global Science and Technology, Inc.)
-
Producer
- Scott Wiessinger (USRA)
-
Writer
- Francis Reddy (University of Maryland College Park)
-
Scientists
- Gabriele Brambilla (University of Milan)
- Alice Harding (NASA/GSFC)
Series
This page can be found in the following series:Datasets used
-
Brambilla Pulsar Model
ID: 1013
Note: While we identify the data sets used on this page, we do not store any further details, nor the data sets themselves on our site.
Related
- ID: 4637
 Visualization
 - ID: 4638
 Visualization
 - ID: 4644
 Visualization
 - ID: 4645
 Visualization
 - ID: 4646
 Visualization
 - ID: 4648
 Visualization
Used as a Source In
- ID: 13058
 Produced Video
Release date
This page was originally published on Wednesday, October 10, 2018.
This page was last updated on Monday, January 6, 2025 at 12:12 AM EST.