ICON and GOLD: Exploring the Interface to Space
- Visualizations by:
- Tom Bridgman
- Scientific consulting by:
- Jeff Klenzing
- Produced by:
- Genna Duberstein
- View full credits
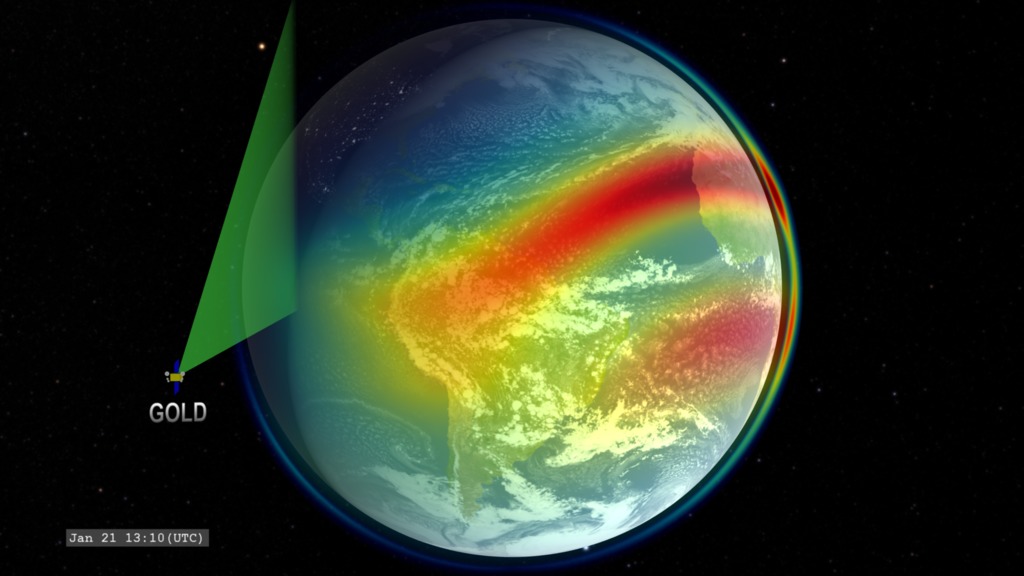
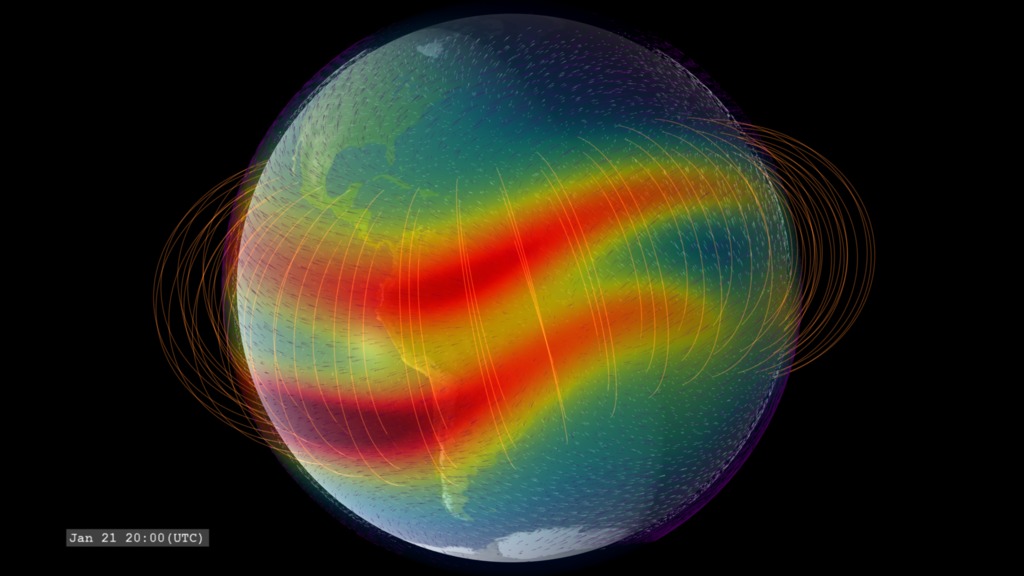
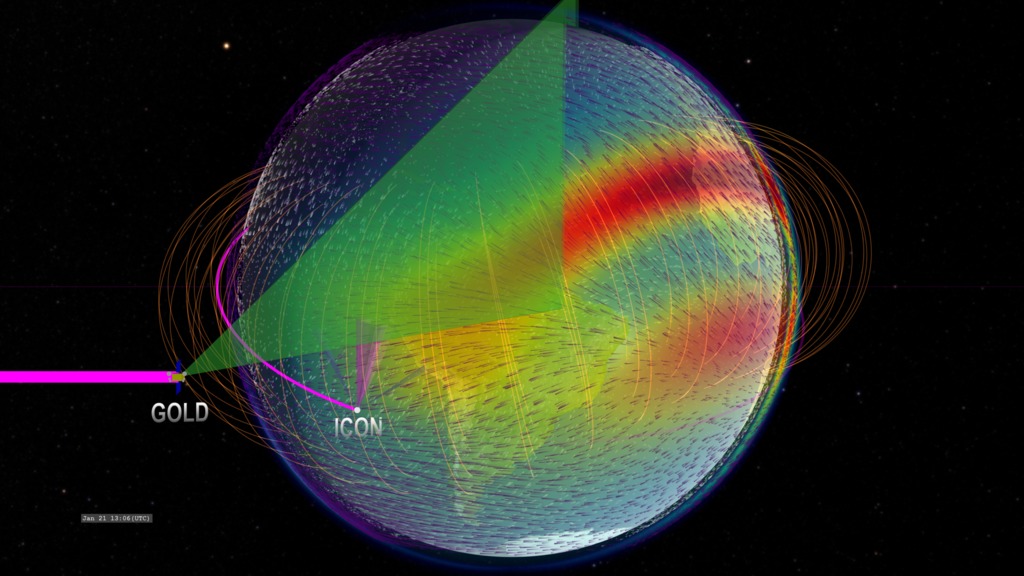
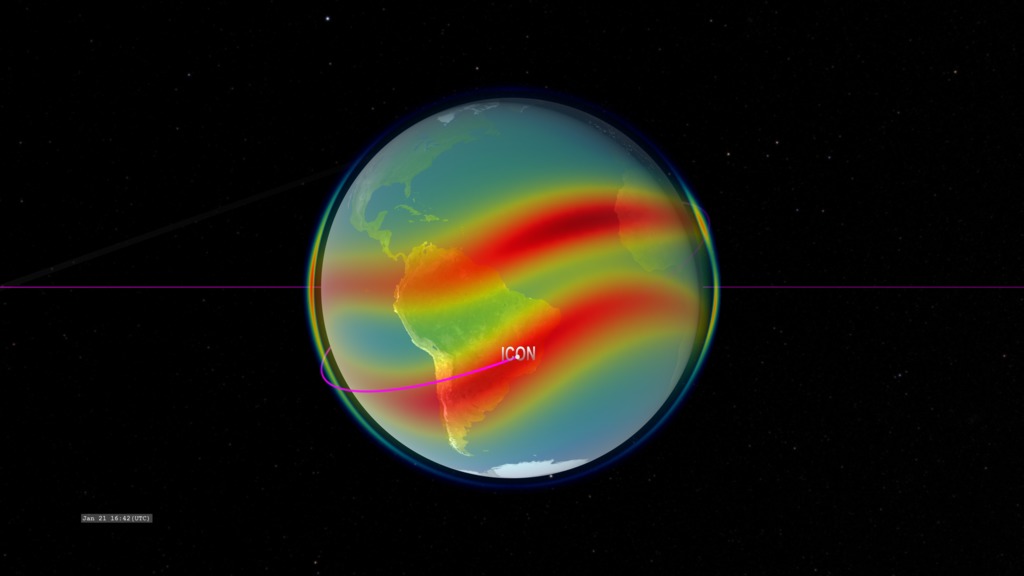
In this visualization, we present GOLD (in geostationary orbit around Earth) and ICON (in low Earth orbit). The colors over Earth represent model data from the IRI (International Reference Ionosphere) model of the density of the singly-ionized oxygen atom at an altitude of 350 kilometers. Red represents high density. The ion density is enhanced above and below the geomagnetic equator (not perfectly aligned with the geographic equator) on the dayside due to the ionizing effects of solar ultraviolet radiation combined with the effects of high-altitude winds and the geomagnetic field.
Movies
- IRIDaily.SimplePushIn_O+ion.IRIinterp.HD1080i_p30.mp4 (1920x1080) [30.1 MB]
- IRIDaily.SimplePushIn_O+ion.IRIinterp.HD1080i_p30.webm (1920x1080) [8.5 MB]
- IRIDaily.SimplePushIn_O+ion.IRIinterp_2160p30.mp4 (3840x2160) [108.3 MB]
Images
- IRIDaily.SimplePushIn_O+ion.clockSlate_CRTT.UHD3840.000101_print.jpg (1024x576) [48.7 KB]
Frames
- frames/1920x1080_16x9_30p/IRI.interpolated/ (1920x1080) [176.0 KB]
- frames/3840x2160_16x9_30p/IRI.interpolated/ (3840x2160) [176.0 KB]
A simple view of the orbits for ICON and GOLD. This version interpolates the IRI model to a higher time cadence for a smoother animation.

Color bar of singly-ionized atomic oxygen density.
Movies
- IRIDaily.SimplePushIn_O+ion.HD1080i_p30.mp4 (1920x1080) [29.1 MB]
- IRIDaily.SimplePushIn_O+ion.HD1080i_p30.webm (1920x1080) [8.5 MB]
- IRIDaily.SimplePushIn_O+ion.UHD3840_2160p30.mp4 (3840x2160) [102.9 MB]
Images
- IRIDaily.SimplePushIn_O+ion.clockSlate_CRTT.HD1080i.000100_print.jpg (1024x576) [46.9 KB]
- IRIDaily.SimplePushIn_O+ion.clockSlate_CRTT.HD1080i.000100_thm.png (80x40) [2.2 KB]
- IRIDaily.SimplePushIn_O+ion.clockSlate_CRTT.HD1080i.000100_searchweb.png (320x180) [44.4 KB]
Frames
- frames/1920x1080_16x9_30p/IRI.raw/ (1920x1080) [176.0 KB]
- frames/3840x2160_16x9_30p/IRI.raw/ (3840x2160) [176.0 KB]
A simple view of the orbits for ICON and GOLD. In this version, the oxygen ion ionosphere model is sampled at 15 minute cadence which creates some 'jumping' in the ionosphere enhancements.
Credits
Please give credit for this item to:
NASA's Scientific Visualization Studio
Visualizer
- Tom Bridgman (GST) [Lead]
Writer
- Sarah Frazier (SGT)
Scientists
- Jeff Klenzing (None) [Lead]
- Sarah L. Jones (NASA/GSFC)
Producer
- Genna Duberstein (ADNET) [Lead]
Technical support
- Ian Jones (ADNET)
- Laurence Schuler (ADNET)
Missions
This visualization is related to the following missions:Series
This visualization can be found in the following series:Datasets used in this visualization
IRI 2016 (A.K.A. International Reference Ionosphere)
Note: While we identify the data sets used in these visualizations, we do not store any further details nor the data sets themselves on our site.
Related pages
Observing Earth's Ionosphere with GOLD
July 17th, 2019
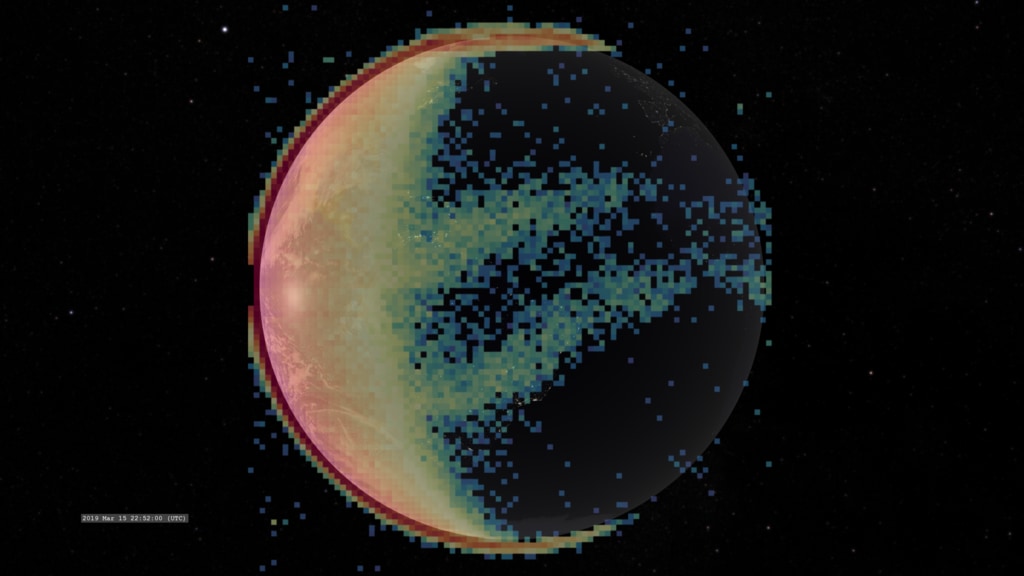
Read moreA visualization of GOLD data observing Earth's ionosphere in ultraviolet light around the wavelength of an atomic oxygen emission. A visualization of GOLD data observing Earth's ionosphere in ultraviolet light also indicating the structure of the low-latitude geomagnetic field (gold curves). Color bar for GOLD radiance values near oxygen emission line. This is a visualization of data taken by the GOLD spectrometer aboard the SES-14 satellite. SES 14 is positioned in a geostationary orbit above 47.5 degrees west longitude so it always observes the same hemisphere. This data is of ultraviolet emission from Earth's ionosphere in a band near the wavelength of 135.6 nanometers, an emission line of atomic oxygen.This data is presented with a spectral color table, where red is the bright and violet is dim. We see some this emission in the aurora (visible at the north and south polar regions), energized by electrons and ions streaming in from Earth's magnetic field. More emission is created during the day by sunlight pumping atomic oxygen into an energetic state. As the sun sets, the oxygen decays from the energized state, releasing a photon of ultraviolet light. We see more emission from two bands near the equator after sunset. This double-lobed enhancement straddles the magnetic equator which is offset around the geographic equator, especially over South America. This enhancement corresponds to the Appleton anomaly, originally discovered in 1946. In the version showing the geomagnetic field, it is easy to see how the field channels the excited atoms. See also Interface to Space: The Equatorial Fountain.GOLD is a scanning instrument that alternates between scanning the northern hemisphere, and then the southern hemisphere (other scanning modes are possible, but not included in this visualization). The full-disk images shown here are created by combining these two hemisphere scans. The time difference between the scans creates a discontinuity at the equator which is particularly visible at the day-night terminator when these scans are combined for full-disk imaging. Differences between the north-south scan interval and south-north interval makes changes in this edge.Between about 22:00 UT and 06:00UT the next day, there is a large data gap because the Sun would appear behind the Earth from the position of GOLD and potentially shine directly into the GOLD instrument. For More InformationSee [NASA Mission Page](https://www.nasa.gov/content/goddard/gold) Related pages
GOLD Resources
Jan. 24th, 2018
Read moreArtist rendering of SES-14 satellite, the spacecraft that will carry GOLD as NASA's first ever hosted payload.Credit: NASA/CIL/Chris Meaney Canned interview with NASA Scientist Elsayed Talaat looking off camera. Soundbites are separated by slates. Full title: Elsayed Talaat, Heliophysics Chief Scientist, NASA Headquarters, Washington Complete transcript available. Canned interview with NASA Scientist Sarah Jones looking off camera. Soundbites are separated by slates.Full title: Sarah Jones, Research Scientist, NASA's Goddard Space Flight CenterComplete transcript available. Canned interview with Scientist Katelynn Greer looking off camera. Soundbites are separated by slates. Includes transcript of soundbites.Full title: Katelynn Greer, Research Scientist, Laboratory for Atmospheric and Space Physics at the University of Colorado BoulderComplete transcript available. Bright swaths of red and green, known as airglow, are visible in this time-lapse view of Earth's limb captured from the International Space Station. Airglow occurs when gases in the upper atmosphere become charged by the Sun's radiation, emitting light. By measuring the light from airglow, ICON and GOLD will learn a lot about the neutral and charged particles in the upper atmosphere. This infographic compares the GOLD and ICON missions, which together will provide the most ever comprehensive observations of the ionosphere.A PDF is available to download at the bottom of the page. Credit: Mary P. Hrybyk-KeithThis infographic compares the GOLD and ICON missions, which together will provide the most ever comprehensive observations of the ionosphere.A PDF is available to download at the bottom of the page. Credit: Mary P. Hrybyk-Keith Part 1/2: A flyer with information on the GOLD mission’s science goals, instrument and orbit.A PDF is available to download at the bottom of the page. Credit: Mary P. Hrybyk-Keith Part 2/2: A flyer with information on the GOLD mission’s science goals, instrument and orbit.A PDF is available to download at the bottom of the page.Credit: Mary P. Hrybyk-Keith Slug: NASA GOLD Mission to Image Earth’s Interface to SpaceOn Thursday, Jan. 25, 2018, the Global-scale Observations of the Limb and Disk, or GOLD, mission launches to explore Earth’s boundary to space. Capturing never-before-seen images of Earth’s upper atmosphere, GOLD will help us understand the region that is home to astronauts, radio signals used to guide airplanes and ships, as well as satellites that provide communications and GPS systems.TRT: 6:31Edited B-roll RT: :52Interview Excerpts RT: 1:02Additional B-Roll RT: 3:05Super(s): NASACenter Contact: Karen Fox, karen.c.fox@nasa.gov, 301-286-6284HQ Contact: Dwayne Brown, dwayne.c.brown@nasa.gov, 202-358-1726For more information: www.nasa.gov/GOLD The Global-scale Observations of the Limb and Disk, or GOLD, mission is designed to explore the nearest reaches of space. Capturing never-before-seen images of Earth’s upper atmosphere, GOLD explores in unprecedented detail our space environment — which is home to astronauts, radio signals used to guide airplanes and ships, as well as satellites that provide communications and GPS systems. The more we know about the fundamental physics of this region of space, the more we can protect our assets there.Gathering observations from geostationary orbit above the Western Hemisphere, GOLD measures the temperature and composition of neutral gases in Earth’s thermosphere. This part of the atmosphere co-mingles with the ionosphere, which is made up of charged particles. Both the Sun from above and terrestrial weather from below can change the types, numbers, and characteristics of the particles found here — and GOLD helps track those changes.Activity in this region is responsible for a variety of key space weather events. GOLD scientists are particularly interested in the cause of dense, unpredictable bubbles of charged gas that appear over the equator and tropics, sometimes causing communication problems. As we discover the very nature of the Sun-Earth interaction in this region, the mission could ultimately lead to ways to improve forecasts of such space weather and mitigate its effects. For More InformationSee [https://www.nasa.gov/feature/goddard/2018/nasa-gold-mission-to-image-earth-s-interface-to-space](https://www.nasa.gov/feature/goddard/2018/nasa-gold-mission-to-image-earth-s-interface-to-space) Related pages
GOLD: Instrument Scanning Coverage
Jan. 19th, 2018
Read moreVisualization of GOLD orbiting Earth with image scanning. This version presents the singly-ionized oxygen density from the IRI model. A basic view of the orbit for GOLD (Global-scale Observations of the Limb and Disk). This mission will conduct measurements of ionospheric composition and ionization better understand the connection between space weather and its terrestrial impacts.In this visualization, we present GOLD in geostationary orbit around Earth. The colors over Earth represent model data from the IRI (International Reference Ionosphere) model of the density of the singly-ionized oxygen atom at an altitude of 350 kilometers. Red represents high density. The ion density is enhanced above and below the geomagnetic equator (not perfectly aligned with the geographic equator) on the dayside due to the ionizing effects of solar ultraviolet radiation combined with the effects of high-altitude winds and the geomagnetic field.In the latter half of the visualization, the viewing fields of the GOLD instrument are displayed. GOLD has an imaging spectrometer (green) that periodically scans the disk of Earth with additional higher-resolution scans of the dayside limb. Related pages
Why NASA Is Exploring The Edge Of Our Planet
Jan. 5th, 2018
Read moreComplete transcript available.Music credits: 'Faint Glimmer' by Andrew John Skeet [PRS], Andrew Michael Britton [PRS], David Stephen Goldsmith [PRS], 'Ocean Spirals' by Andrew John Skeet [PRS], Andrew Michael Britton [PRS], David Stephen Goldsmith [PRS] from Killer Tracks.Watch this video on the NASA Goddard YouTube channel. A GIF optimized for Twitter.Formed when the Sun’s rays hit atmospheric molecules, this light named “airglow”, comes from green and red bands of glowing gas. Bright swaths of red and green, known as airglow, are visible in this time-lapse view of Earth's limb captured from the International Space Station. Airglow occurs when gases in the upper atmosphere become charged by the Sun's radiation, emitting light. By measuring the light from airglow, ICON and GOLD will learn a lot about the neutral and charged particles in the upper atmosphere. The Global-scale Observations of the Limb and Disk, or GOLD, instrument launches aboard a commercial communications satellite in January 2018 to inspect the dynamic intermingling of space and Earth’s uppermost atmosphere. Together, GOLD and another NASA mission, Ionospheric Connection Explorer spacecraft, or ICON, will provide the most comprehensive of Earth’s upper atmosphere we’ve ever had.Above the ozone layer, the ionosphere is a part of Earth’s atmosphere where particles have been cooked into a sea of electrically-charged electrons and ions by the Sun’s radiation. The ionosphere is co-mingled with the very highest — and quite thin — layers of Earth’s neutral upper atmosphere, making this region an area that is constantly in flux undergoing the push-and-pull between Earth’s conditions and those in space. Increasingly, these layers of near-Earth space are part of the human domain, as it’s home not only to astronauts, but to radio signals used to guide airplanes and ships, and satellites that provide our communications and GPS systems. Understanding the fundamental processes that govern our upper atmosphere and ionosphere is crucial to improve situational awareness that helps protect astronauts, spacecraft and humans on the ground.GOLD, in geostationary orbit over the Western Hemisphere, will build up a full-disk view of the ionosphere and upper atmosphere every half hour, providing detailed large-scale measurements of related processes — a cadence which makes it the first mission to be able to monitor the true weather of the upper atmosphere. GOLD is also able to focus in on a tighter region and scan more quickly, to complement additional research plans as needed. For More InformationSee [https://www.nasa.gov/feature/goddard/2018/nasa-gold-mission-to-image-earth-s-interface-to-space](https://www.nasa.gov/feature/goddard/2018/nasa-gold-mission-to-image-earth-s-interface-to-space) Related pages
ICON Scans the Ionosphere
Oct. 31st, 2017
Read moreICON orbits Earth at 575 kilometers altitude, measuring the composition and motions of the ionosphere. The ICON (Ionospheric Connection Explorer) satellite orbits Earth at an altitude of 575 kilometers. In this visualization, we show the ICON spacecraft with the fields-of-view of four instruments for measuring the properties of the ionosphere. ICON has an EUV (Extreme Ultraviolet) and FUV (Far Ultraviolet) imagers (violet colored frustrums directed from spacecraft) pointing perpendicular to the orbit direction for detecting ionospheric emissions. Two Doppler interferometer imagers, MIGHTI (Michelson Interferometer for Global High-resolution Thermospheric Imaging), represented by the blue frustrums, are directed at 45 degrees from the EUV and FUV imagers to measure ionospheric wind velocities.Three reference models important in ionospheric physics are presented in this visualization. One of the goals of ICON is to improve on these models.International Reference Ionosphere (IRI)This model provides parameters such as electron temperature and density, ion temperature and the densities of various ions (O+, H+, He+, NO+, O2+). In this visualization, we display the atomic oxygen positive ion (a single atom ion) density at an altitude of 350 kilometers. On the limb of Earth, we present a vertical cross-section of the model, illustrating how the density varies with altitude and providing an altitude scale for comparison. This dataset exhibits two notable characteristics.Daily variation: The oxygen ion density increases during the day and then decreases after nightfall. This is due to photoionization by solar ultraviolet light, which increases with sunrise to a maximum at local noon, and then decreases towards evening.Appleton Anomaly: One of the more striking features of the ion density is the daytime enhancement is split into two regions, distributed symmetrically above and below the magnetic equator. This feature was discovered by Edward Appleton in 1946. It is now understood to be an effect of the interaction of Earth's geomagnetic field with upper atmosphere electric fields, and often referred to as the 'fountain effect,' explained in 1965. The electric fields lift ions and electrons upward by E-cross-B drift (Plasma Zoo). At higher altitudes, the upward drift decreases and the geomagnetic field and gravity dominate the motion, guiding the charged particles earthward.Horizontal Wind Model (HWM)This model provides speed and direction of horizontal (parallel to Earth's surface) winds constructed from over 70 million ground-based and satellite measurements. Two altitude levels are displayed in this visualization: 350 kilometers (same altitude as the IRI oxygen ion data) in violet glyphs, and 100 kilometers (white glyphs). This model only extends to 60 degrees latitude, so there are gaps around the poles in this visualization.One of the most notable characteristics in this dataset, particularly the 350 kilometer data, is how the winds are driven by the daily solar heating cycle. As the sun rises, the upper atmosphere is heated by solar ultraviolet light. This creates a high-pressure region which drives the atmosphere away from direct sunlight; westward in the morning and eastward in the afternoon. As the sun sets and the atmosphere cools, we see the wind reverse, filling in the now cooler and lower-pressure region.International Geomagnetic Reference Field-12 (IGRF-12)This model provides the structure of Earth's magnetic field which is a dominant influence on the motion of electrons and ions in the ionosphere. The geomagnetic field changes very slowly over decades. For this visualization, we display only a few field lines (golden wire-like structures) near the geomagnetic equator. As we observe the daily variation of the data, particularly the oxygen ions, we see the Appleton anomaly is hedged in by the low-latitude geomagnetic field.ReferencesNOAA/National Geophysical Data Center. International Geomagnetic Reference FieldErwan Thebault, Christopher C. Finlay, et al. International Geomagnetic Reference Field: the 12th generation. Earth, Planets and Space 67:79 (2015)Dieter Bilitza. The International Reference Ionosphere - Status 2013. Advances in Space Research, Volume 55, p. 1914-1927 (2015)Douglas P. Drob, John T. Emmert, et al. An update to the Horizontal Wind Model (HWM): The quiet time thermosphere. Earth and Space Science, vol. 2, issue 7, pp. 301-319Edward V. Appleton. Two Anomalies in the Ionosphere. Nature, Volume 157, pp. 691 (1946)E. N. Bramley and M. Peart. Diffusion and electromagnetic drift in the equatorial F2-region. Journal of Atmospheric and Terrestrial Physics, vol. 27, pp. 1201-1211 (1965)R.J. Moffett & W.B. Hanson. Effect of Ionization Transport on the Equatorial F-Region. Nature 206, pp705-706 (1965) Related pages
Exploring Earth's Ionosphere: Limb view with approach
Jan. 13th, 2017
Read moreOxygen ion enhancements at 350km altitude, ionospheric winds at altitudes of 100 km (white) and 350 km (violet) and the low-latitude geomagnetic field. Oxygen ion enhancements at 350km altitude and the low-latitude geomagnetic field. Oxygen ion enhancements at 350km altitude, ionospheric winds at altitudes of 100 km (white) and 350 km (violet). Oxygen ion enhancements at 350km altitude. Color bar for oxygen ion density. This visualization presents several 'reference models' for studying Earth's ionosphere. It opens with a full-disk view of Earth, then zooms-in to a close-up view of Earth's limb and ionospheric data-driven models, over a fixed geographic location - off the Atlantic coast of South America.Reference models are used to define well-established knowledge and facilitate mapping out areas for future exploration. The models might be described as semi-empirical, in that they are generated using many measurements at a varietly of locations, and those measurements are used to constrain a theoretical model which is used to estimate measurements at locations where an actual measurement is not available.Three models important in ionospheric physics are presented in this visualization.International Reference Ionosphere (IRI)This model provides parameters such as electron temperature and density, ion temperature and the densities of various ions (O+, H+, He+, NO+, O2+). In this visualization, we display the atomic oxygen positive ion (a single atom ion) density at an altitude of 350 kilometers. On the limb of Earth, we present a vertical cross-section of the model, illustrating how the density varies with altitude and providing an altitude scale for comparison. This dataset exhibits two notable characteristics.Daily variation: The oxygen ion density increases during the day and then decreases after nightfall. This is due to photoionization by solar ultraviolet light, which increases with sunrise to a maximum at local noon, and then decreases towards evening.Appleton Anomaly: One of the more striking features of the ion density is the daytime enhancement is split into two regions, distributed symmetrically above and below the magnetic equator. This feature was discovered by Edward Appleton in 1946. It is now understood to be an effect of the interaction of Earth's geomagnetic field with upper atmosphere electric fields, and often referred to as the 'fountain effect,' explained in 1965. The electric fields lift ions and electrons upward by E-cross-B drift (Plasma Zoo). At higher altitudes, the upward drift decreases and the geomagnetic field and gravity dominate the motion, guiding the charged particles earthward.Horizontal Wind Model (HWM)This model provides speed and direction of horizontal (parallel to Earth's surface) winds constructed from over 70 million ground-based and satellite measurements. Two altitude levels are displayed in this visualization: 350 kilometers (same altitude as the IRI oxygen ion data) in violet glyphs, and 100 kilometers (white glyphs). This model only extends to 60 degrees latitude, so there are gaps around the poles in this visualization.One of the most notable characteristics in this dataset, particularly the 350 kilometer data, is how the winds are driven by the daily solar heating cycle. As the sun rises, the upper atmosphere is heated by solar ultraviolet light. This creates a high-pressure region which drives the atmosphere away from direct sunlight; westward in the morning and eastward in the afternoon. As the sun sets and the atmosphere cools, we see the wind reverse, filling in the now cooler and lower-pressure region.International Geomagnetic Reference Field-12 (IGRF-12)This model provides the structure of Earth's magnetic field which is a dominant influence on the motion of electrons and ions in the ionosphere. The geomagnetic field changes very slowly over decades. For this visualization, we display only a few field lines (golden wire-like structures) near the geomagnetic equator. As we observe the daily variation of the data, particularly the oxygen ions, we see the Appleton anomaly is hedged in by the low-latitude geomagnetic field.ReferencesNOAA/National Geophysical Data Center. International Geomagnetic Reference FieldErwan Thebault, Christopher C. Finlay, et al. International Geomagnetic Reference Field: the 12th generation. Earth, Planets and Space 67:79 (2015)Dieter Bilitza. The International Reference Ionosphere - Status 2013. Advances in Space Research, Volume 55, p. 1914-1927 (2015)Douglas P. Drob, John T. Emmert, et al. An update to the Horizontal Wind Model (HWM): The quiet time thermosphere. Earth and Space Science, vol. 2, issue 7, pp. 301-319Edward V. Appleton. Two Anomalies in the Ionosphere. Nature, Volume 157, pp. 691 (1946)E. N. Bramley and M. Peart. Diffusion and electromagnetic drift in the equatorial F2-region. Journal of Atmospheric and Terrestrial Physics, vol. 27, pp. 1201-1211 (1965)R.J. Moffett & W.B. Hanson. Effect of Ionization Transport on the Equatorial F-Region. Nature 206, pp705-706 (1965) Related pages
ICON and GOLD: Instrument Scanning Coverage
Dec. 14th, 2016
Read moreVisualization of ICON and GOLD orbiting Earth with image scanning. This version presents several geospace models, including the singly-ionized oxygen density, the low-latitude geomagnetic field, and the high-altitude winds (100km and 350km altitudes). Color bar of singly-ionized atomic oxygen density. Visualization of ICON and GOLD orbiting Earth with image scanning. This version presents several geospace models, including the singly-ionized oxygen density and the high-altitude winds (100km and 350km altitudes). Visualization of ICON and GOLD orbiting Earth with image scanning. This is an older version which is superceeded by the versions above. A basic view of the orbits for ICON (Ionospheric Connections Explorer) and GOLD (Global-scale Observations of the Limb and Disk). These missions will conduct measurements of ionospheric composition, ionization, and winds to better understand the connection between space weather and its terrestrial impacts.In this visualization, we present GOLD (in geostationary orbit around Earth) and ICON (in low Earth orbit). The colors over Earth represent model data from the IRI (International Reference Ionosphere) model of the density of the singly-ionized oxygen atom at an altitude of 350 kilometers. Red represents high density. The ion density is enhanced above and below the geomagnetic equator (not perfectly aligned with the geographic equator) on the dayside due to the ionizing effects of solar ultraviolet radiation combined with the effects of high-altitude winds and the geomagnetic field.In the latter half of the visualization, the viewing fields of the various instruments are displayed. ICON has an EUV (Extreme Ultraviolet) and FUV (Far Ultraviolet) cameras (violet colored frustrums directed from spacecraft) pointing perpendicular to the orbit direction for detecting ionospheric emissions. Two Doppler interferometer cameras (blue) are directed at 45 degrees from this camera to detect ionospheric wind velocities.GOLD has an imaging spectrometer (green) that periodically scans the disk of Earth with additional higher-resolution scans of the dayside limb. Related pages
Exploring the Ionosphere: The View from GOLD
Oct. 27th, 2016
Read moreCloseup view of Earth from the perspective of the GOLD instrument. This version interpolates the IRI model to a higher time cadence for a smoother animation. Closeup view of Earth from the perspective of the GOLD instrument. Color bar of singly-ionized atomic oxygen density. Closeup view of Earth from the perspective of the GOLD instrument. This version has no satellites. A view of Earth from the point-of-view of the GOLD (Global-scale Observations of the Limb and Disk) instrument in geostationary orbit. This mission will conduct measurements of ionospheric composition to better understand the connection between space weather and its terrestrial impacts.ICON (Ionospheric Connections Explorer) orbits much closer to Earth. The colors over Earth represent model data from the IRI (International Reference Ionosphere) model of the density of the singly-ionized oxygen atom at an altitude of 350 kilometers. Red represents high density. The ion density is enhanced above and below the geomagnetic equator (not perfectly aligned with the geographic equator) on the dayside due to the ionizing effects of solar ultraviolet radiation combined with the effects of high-altitude winds and the geomagnetic field. This ion density decreases at night as the ions recombine with free electrons. At the limb of Earth, we present a cross-sectional profile of the density enhancement. For More InformationSee [NASA.gov](https://www.nasa.gov/feature/goddard/2018/two-heads-are-better-than-one-icon-gold-teaming-up-to-explore-earths-interface-to-space) Related pages
Exploring the Ionosphere: The Dayside Ionosphere
Oct. 27th, 2016
Read moreA view of the singly-ionizing oxygen atom on the dayside of Earth. This represents the variation of the enhancments due to variation in the geomagnetic field. This version interpolates the IRI model to a higher time cadence for a smoother animation. Color bar of singly-ionized atomic oxygen density. A view of the singly-ionizing oxygen atom on the dayside of Earth. This represents the variation of the enhancments due to variation in the geomagnetic field. In this version, the oxygen ion ionosphere model is sampled at 15 minute cadence which creates some 'jumping' in the ionosphere enhancements. The colors over Earth represent model data from the IRI (International Reference Ionosphere) model of the density of the singly-ionized oxygen atom at an altitude of 350 kilometers. Red represents high density. The ion density is enhanced above and below the geomagnetic equator (not perfectly aligned with the geographic equator) on the dayside due to the ionizing effects of solar ultraviolet radiation combined with the effects of high-altitude winds and the geomagnetic field. This ion density decreases at night as the ions recombine with free electrons. Related pages