Global Hawk aircraft observes Hurricane Edouard
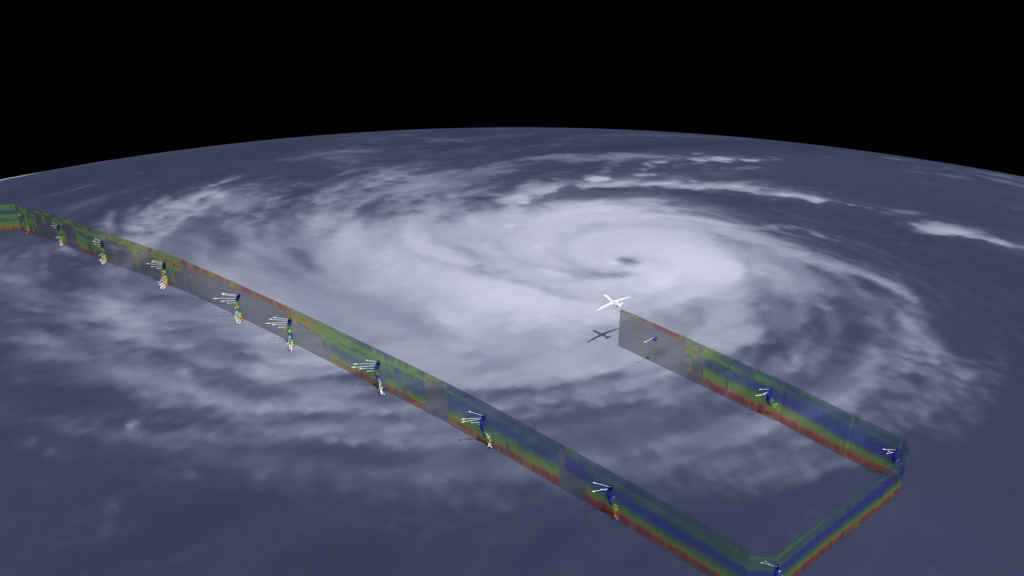
This animation shows how NASA scientists used an unmanned Global Hawk aircraft to study Hurricane Edouard. Dropsonde data is compared to SHIS curtain data as the aircraft flies back and forth over the storm. Relative humidity is displayed with blue representing dry air and red representing moist air. Additionally, dropsonde wind vector data is displayed using white arrows.
This video is also available on our YouTube channel.
NASA's Hurricane and Severe Storm Sentinel (HS3, 2012-2014) investigation was a mission that brought together several NASA centers with federal and university partners to investigate the processes that underlie hurricane formation and intensity change in the Atlantic Ocean basin. The aircraft was equipped with the Advanced Vertical Atmospheric Profiling System (AVAPS) dropsonde system that releases small instrumented packages from the aircraft that fall to the surface while measuring profiles of temperature, humidity, and winds; the Scanning High-resolution Interferometer Sounder (S-HIS) that measures profiles of temperature and humidity; and the Cloud Physics Lidar (CPL) that measures cloud and aerosol total backscattered energy.
NASA's HS3 mission pilots operated the Global Hawk aircraft on four consecutive 24-hour flights on Sept. 11-12, 14-15, 16-17, 18-19 into Hurricane Edouard and scored a bullseye by gathering information in the eye of the strengthening storm. During the Sept. 14-15 flight, the data from the Global Hawk revealed a storm that was quickly intensifying from a Category-1 to a Category-2 intensity storm.
For more information about NASA's HS3 mission, visit:
http://www.nasa.gov/hs3
This animation shows how NASA scientists used an unmanned Global Hawk aircraft to study Hurricane Edouard. Dropsonde data is compared to SHIS curtain data as the aircraft flies back and forth over the storm. Relative humidity is displayed with blue representing dry air and red representing moist air. Additionally, dropsonde wind vector data is displayed using white arrows. This alternative version ends with a top-down view of the center of the storm.
This video is also available on our YouTube channel.
No legend - This animation shows how NASA scientists used an unmanned Global Hawk aircraft to study Hurricane Edouard. Dropsonde data is compared to SHIS curtain data as the aircraft flies back and forth over the storm. Relative humidity is displayed with blue representing dry air and red representing moist air. Additionally, dropsonde wind vector data is displayed using white arrows.
No legend - This animation shows how NASA scientists used an unmanned Global Hawk aircraft to study Hurricane Edouard. Dropsonde data is compared to SHIS curtain data as the aircraft flies back and forth over the storm. Relative humidity is displayed with blue representing dry air and red representing moist air. Additionally, dropsonde wind vector data is displayed using white arrows. This alternative version ends with a top-down view of the center of the storm
Short zoom in to the region of interest.

Colorbar/legend for relative humidity and wind vector data
Credits
Please give credit for this item to:
NASA's Scientific Visualization Studio
-
Visualizer
-
Kel Elkins
(USRA)

-
Kel Elkins
(USRA)
-
Scientist
- Scott Braun (NASA/GSFC)
Datasets used
-
Relative Humidity [Global Hawk: Dropsondes]
ID: 800 -
HS3 Wind Vector Field (Wind Vector) [HS3 Global Hawk: Dropsonde]
ID: 840
Note: While we identify the data sets used on this page, we do not store any further details, nor the data sets themselves on our site.
Used as a Source In
- ID: 12948
 Produced Video
 - ID: 12821
![NASA's Global Hawk in 2014 traveled to the middle of the Atlantic and flew over Hurricane Edouard. Remote sensing nstruments on the plane measured temperature, relative humidity, wind speed, wind direction as well as other data. Along with measurements from the aircraft, NASA scientists also collected data from dropsondes that parachuted down through the hurricane.Complete transcript available.Music: Who Done It? by Robert Leslie Bennett [ASCAP]Watch this video on the NASA Goddard YouTube channel.](/vis/a010000/a012800/a012821/12821_HS3_dropsondes_youtube_1080.00555_print.jpg) Produced Video
Produced Video
Release date
This page was originally published on Thursday, August 10, 2017.
This page was last updated on Sunday, January 5, 2025 at 11:02 PM EST.