Inside Cyclone Winston (February 20, 2016)
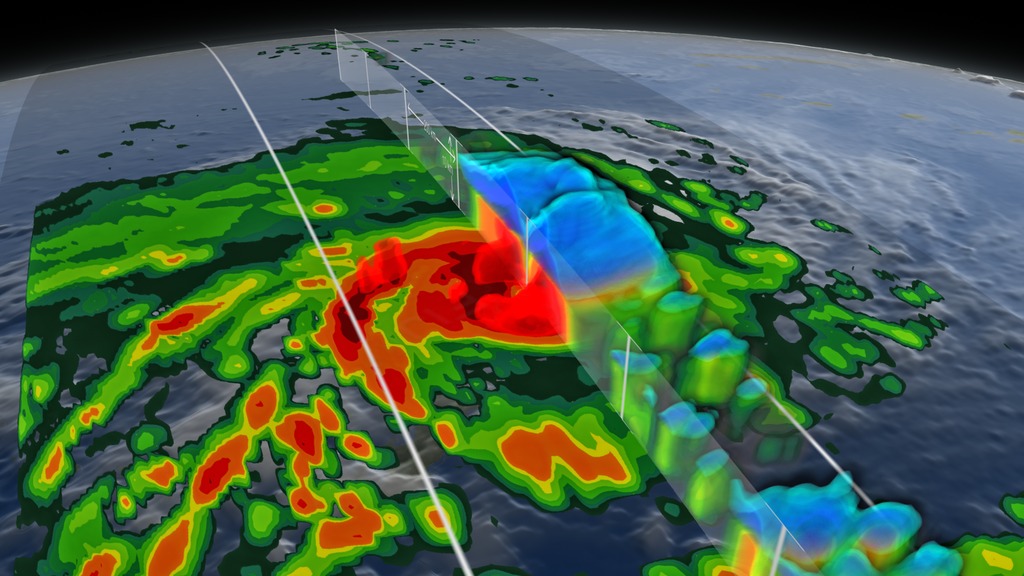
Turntable visualization of Cyclone Winston with a cutting plane through the storm's eye. As the camera swings around the cyclone, the cutting plane stays perpendicular to the camera revealing a cross-section of the cyclone's internal precipitation rates. Extremely heavy precipitation remains outside of the clipping plane, showing a wall of heavy rain around the eye.
This video is also available on our YouTube channel.
The NASA GPM satellite passed directly over Tropical Cyclone Winston just after it made landfall on the north coast of Viti Levu Island, which is the largest and most populated island in the nation of Fiji. At the time, Winston was one of the most intense tropical cyclones observed in the South Pacific Ocean, and took an unusual track on the way to Fiji, completing a large counter-clockwise loop during the preceding week.
NASA's GPM satellite is designed to measure rainfall using both passive microwave (GMI) and radar (DPR) instruments. GMI measurements are sensitive to the column-integrated rain and ice water, and cover a wide swath, whereas the DPR can observe 3D structures of radar signals reflected by rain and snow in a narrower swath. In this animation, the GMI rainfall estimates are shown at the Earth's surface below the 3D storm structure revealed by DPR.
. Shades of cyan represent low amounts of frozen precipitation, whereas shades of purple represent high amounts of precipitation.")
Color bar for frozen precipitation rates (ie, snow rates). Shades of cyan represent low amounts of frozen precipitation, whereas shades of purple represent high amounts of precipitation.
Color bar for liquid precipitation rates (ie, rain rates). Shades of green represent low amounts of liquid precipitation, whereas shades of red represent high amounts of precipitation.
Print resolution still showing a nadir view of Cyclone Winston's surface precipitation rates over the Fiji Islands via GPM's GPROF algorithm.
Print resolution still of a bisected Cyclone Winston with Fiji's main island in the foreground. Even with the eye of the storm Northwest of the main island, one can still see a very heavy precipitation event occuring over the central part of the main island. Volumetric precipitation data is provided by GPM's DPR sensor. Surface precipitation is provided by GPM's GPROF algorithm.
Credits
Please give credit for this item to:
NASA's Scientific Visualization Studio
-
Visualizer
-
Alex Kekesi
(Global Science and Technology, Inc.)

-
Alex Kekesi
(Global Science and Technology, Inc.)
-
Scientists
- Gail Skofronick Jackson (NASA/GSFC)
-
George Huffman
(NASA/GSFC)
- Stephen J. Munchak (University of Maryland)
- Chris Kidd (University of Maryland)
- Dalia B Kirschbaum (NASA/GSFC)
-
Producer
- Rani Gran (NASA/GSFC)
Missions
This page is related to the following missions:Series
This page can be found in the following series:Datasets used
-
CPC (Climate Prediction Center) Cloud Composite
ID: 600Global cloud cover from multiple satellites
See all pages that use this dataset -
Rain Rates (Surface Precipitation) [GPM: GMI]
ID: 822Credit: Data provided by the joint NASA/JAXA GPM mission.
See all pages that use this dataset -
Volumetric Precipitation data (Ku) [GPM: DPR]
ID: 830Credit: Data provided by the joint NASA/JAXA GPM mission.
See all pages that use this dataset
Note: While we identify the data sets used on this page, we do not store any further details, nor the data sets themselves on our site.
Alternate Versions
- ID: 4434
 Visualization
Release date
This page was originally published on Friday, March 11, 2016.
This page was last updated on Sunday, January 5, 2025 at 10:59 PM EST.