Ozone Transport in the Tropical Western Pacific
An animation showing flight 13 from the CONTRAST campaign and the backflow trajectories. The trajectories are coloured by observed aircraft ozone level where blue values represent low concentrations of ozone and red represents high values. This includes a date and colorbar.
NASA-funded scientists have traced the origins of mysterious pockets of high ozone concentrations and low water vapor in the air above the western Pacific Ocean near Guam to fires burning in Southeast Asia and in Africa, half a world away.
These pockets of ozone—a powerful greenhouse gas—are three times more concentrated than surrounding air and are found at around 30,000 feet in the lower part of Earth’s atmosphere known as the troposphere, within the cruising altitude of most commercial airliners. As a greenhouse gas, ozone in the troposphere is an important contributor to global warming, but because it varies widely in where it occurs and how long it stays aloft, its true impact on climate change is hard to determine.
Researchers studying the air over Guam during the winter of 2014 during a pair of airborne field campaigns captured a comprehensive picture of the chemicals traveling with the ozone—chemicals such as hydrogen cyanide and acetonitrile, which originate in fires. Using a data-driven computer model, they then traced the ozone-laden air pockets back 10 to 15 days in most cases—right back to fires in either Southeast Asia, about 2,000 miles away, or tropical Africa, over 8,000 miles away.
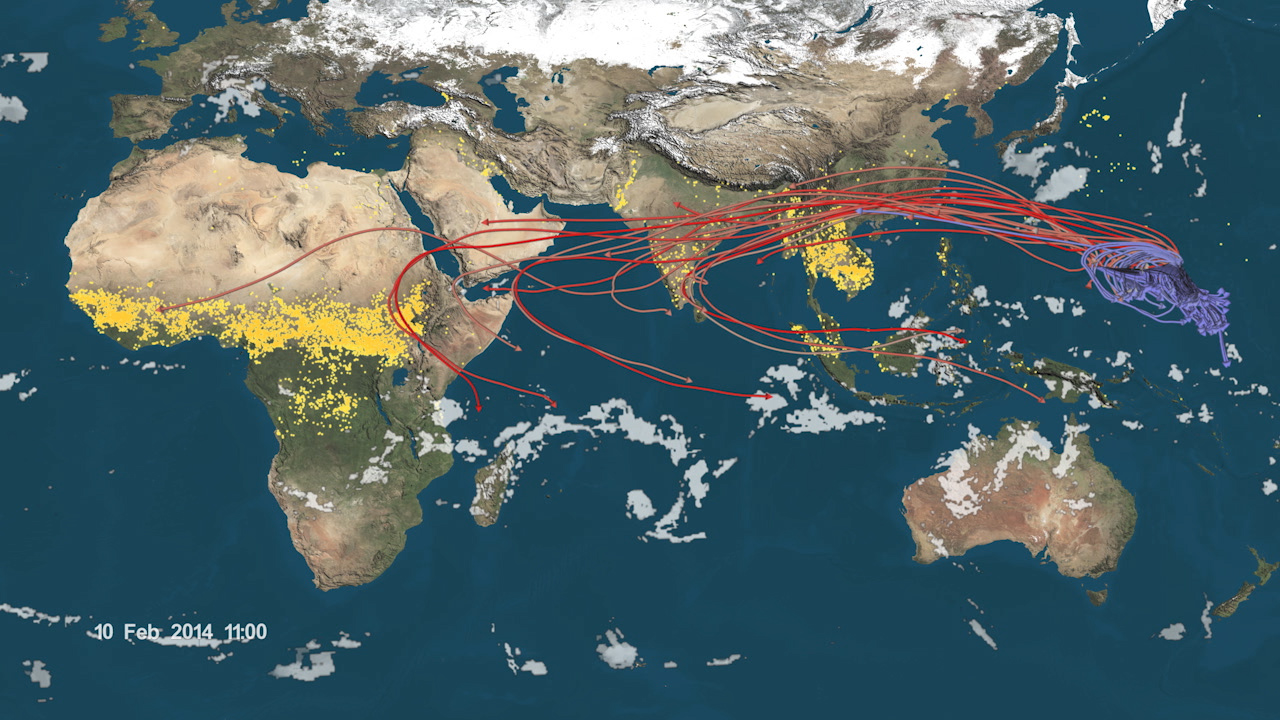
The animation begins by showing a single NCAR Gulfstream V aircraft flight from the CONTRAST campaign that was outfitted to measure various trace gases. From the measurements taken on this flight, the backflow trajectories are modelled using the NOAA HYSPLIT model, stepping back in time for the previous 10 days or until the trajectories encountered convection. The trajectories are coloured by observed aircraft ozone level where blue values represent low concentrations of ozone and red represents high values. The ozone value is invariant along each trajectory. The active fire locations detected during the prior 48 hours are shown as yellow/gold points. Areas depicting highly convective regions are shown in white.
An animation showing flight 13 from the CONTRAST campaign and the backflow trajectories. The trajectories are coloured by observed aircraft ozone level where blue values represent low concentrations of ozone and red represents high values. This includes a date but no colorbar.

A still image showing the location of the measured ozone values ten days prior to the measurement.
The ozone colorbar showing values in parts per billion
Credits
Please give credit for this item to:
NASA's Scientific Visualization Studio
The Blue Marble data is courtesy of Reto Stockli (NASA/GSFC).
-
Visualizers
- Cindy Starr (Global Science and Technology, Inc.)
- Greg Shirah (NASA/GSFC)
-
Scientist
- Daniel C. Anderson (University of Maryland)
-
Technical support
- Laurence Schuler (ADNET Systems, Inc.)
- Ian Jones (ADNET Systems, Inc.)
-
Project support
- Joycelyn Thomson Jones (NASA/GSFC)
- Leann Johnson (Global Science and Technology, Inc.)
- Eric Sokolowsky (Global Science and Technology, Inc.)
-
Producers
- Ellen T. Gray (ADNET Systems, Inc.)
- Sophia Roberts (USRA)
- Kayvon Sharghi (USRA)
Release date
This page was originally published on Wednesday, February 24, 2016.
This page was last updated on Monday, July 15, 2024 at 12:04 AM EDT.
Papers used in this visualization
Datasets used in this visualization
-
Fire Location [Terra and Aqua: MODIS]
ID: 496Credit: Fire location data courtesy of MODIS Rapid Response Project (NASA/GSFC and University of Maryland - http://rapidfire.sci.gsfc.nasa.gov)
See all pages that use this dataset -
Convection Product (Combination of Precipitation Observations) [TRMM and Multiple Geostationary Satellites]
ID: 912 -
Measured Ozone (CONvective TRansport of Active Species in the Tropics: flight 13) [Aircraft: Fast 03]
ID: 913This dataset can be found at: https://www.eol.ucar.edu/field_projects/contrast
See all pages that use this dataset -
Back Trajectories (Calculated with the NOAA HYSPLIT Model)
ID: 914This dataset can be found at: http://ready.arl.noaa.gov/HYSPLIT.php
See all pages that use this dataset
Note: While we identify the data sets used in these visualizations, we do not store any further details, nor the data sets themselves on our site.
Related
- ID: 12161

- ID: 12158