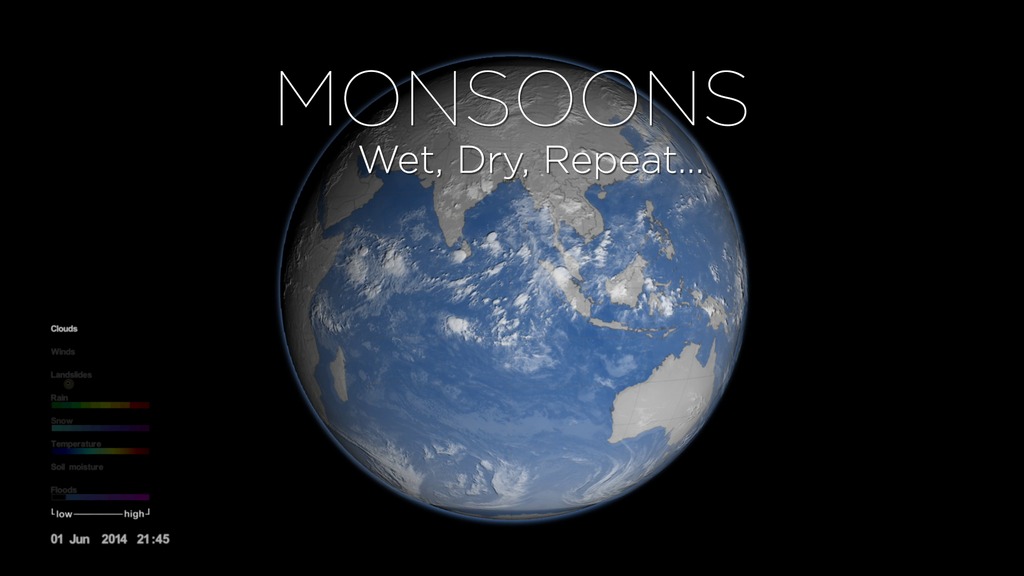
Monsoons: Wet, Dry, Repeat...
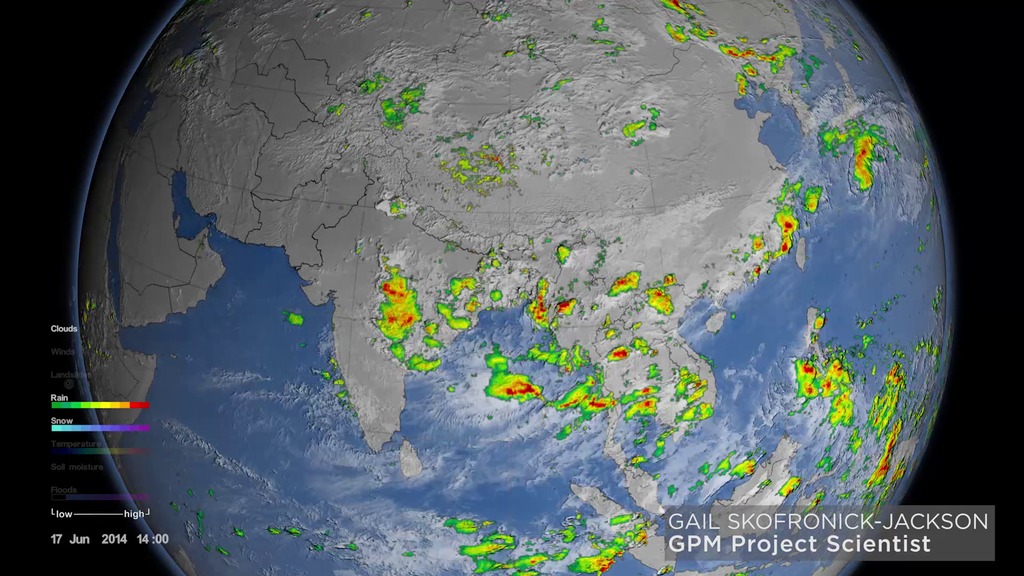
This visualization shows the Asian monsoon and how it develops using observational and modeled data. It also showns some of the impacts.
This video is also available on our YouTube channel.
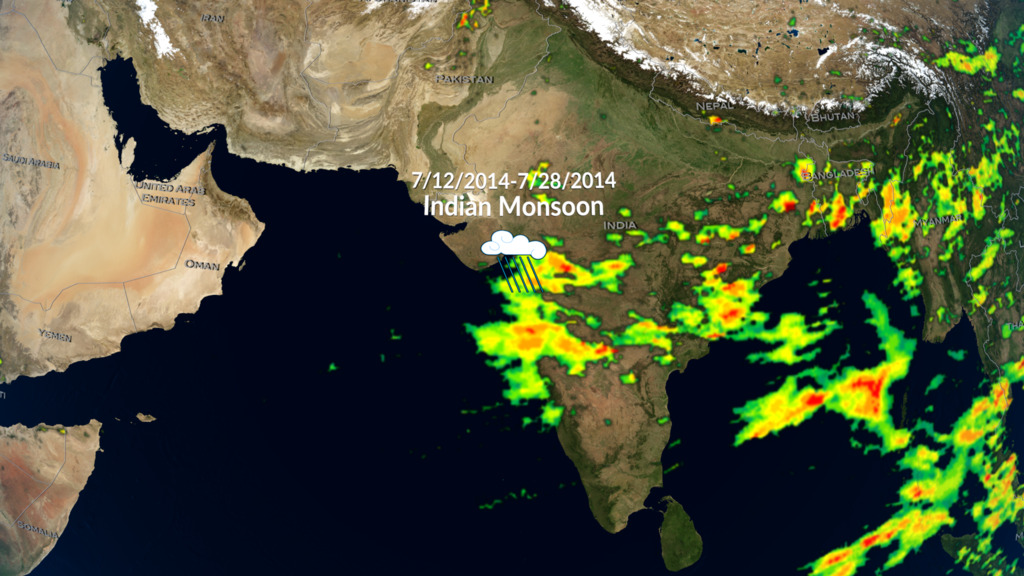
The monsoon is a seasonal rain and wind pattern that occurs over South Asia (among other places). Through NASA satellites and models we can see the monsoon patterns like never before. Monsoon rains provide important reservoirs of water that sustain human activities like agriculture and supports the natural environment through replenishment of aquifers. However, too much rainfall routinely causes disasters in the region, including flooding of the major rivers and landslides in areas of steep topography.
This visualization uses a combination of NASA satellite data and models to show how and why the monsoon develops over this region. In the summer the land gets hotter, heating the atmosphere and pulling in cooler, moisture-laden air from the oceans. This causes pulses in heavy rainfall throughout the region. In the winter the land cools off and winds move towards the warmer ocean and suppressing rainfall on land.
. Through NASA satellites and models we can see the monsoon patterns like never before.")
The monsoon is a seasonal rain and wind pattern that occurs over South Asia (among other places). Through NASA satellites and models we can see the monsoon patterns like never before.
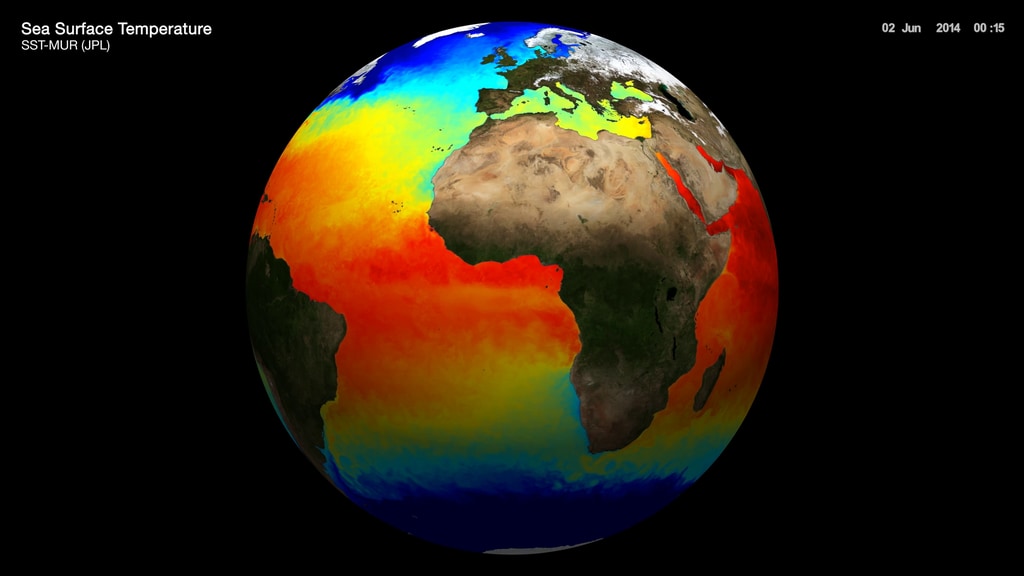
Water evaporates from the ocean, then condenses into clouds and heavy rainfall that winds carry across the region.
The monsoon rains provide important reservoirs of water, including increased soil moisture, which sustains human activities like agriculture and supports the natural environment.
Too much rain is a trigger for flooding. Notice the floods snaking down rivers in the region.
Landslides can be triggered when extreme rainfall intersects topography; this is especially prevalent during the monsoon season.
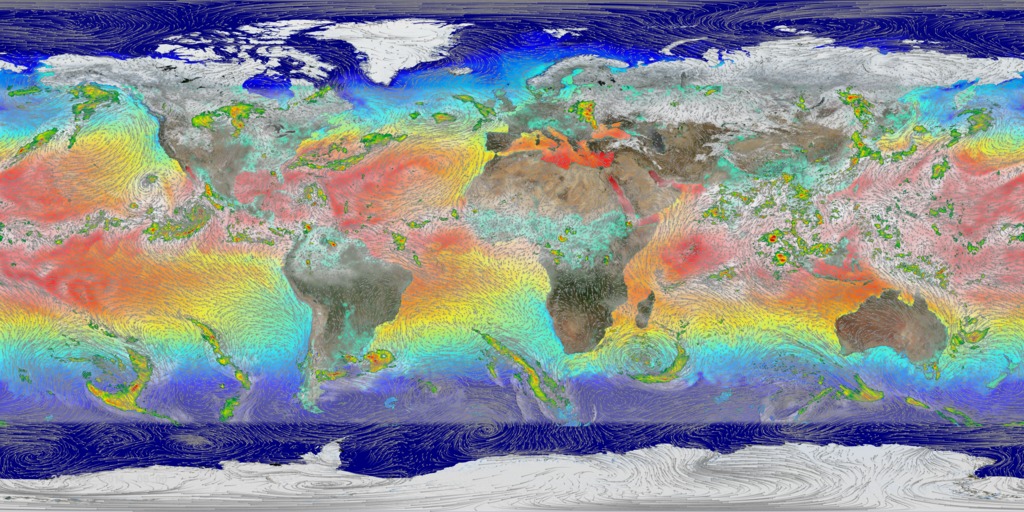
In the summer, moisture-laden winds blow towards Asia from the ocean, carrying rainfall. In the winter, dry winds blow away from the continent.
In the summer the land gets hotter, heating the atmosphere and pulling in cooler air from the oceans. In the winter the land cools off and winds move towards the warmer ocean. Notice that there is a day-night temperature difference that varies around the seasonal averages.
The diurnal cycle is seen as heat from the sun moves around the Earth. Surface temperatures from the MERRA atmospheric model are shown.
MERRA surface temperatures color bar (blue, green, yellow, red)
range: 243.15 to 283.15 Kelvin
GPM/IMERG liquid precipitation color bar (green, yellow, red)
ranges: 0.1, 0.2, 0.3, 0.5, 1.0, 2.0, 3.0, 5.0, 10, 20, 50 mm/hr
GPM/IMERG frozen precipitation color bar (cyan, blue, magenta)
ranges: 0.1, 0.2, 0.3, 0.5, 1.0, 2.0, 3.0, 5.0, 10, 20, 50 mm/hr
Soil ,oisture index color bar
range: 0 to 1
Global Flood Monitoring System color bar (transparent, blue, magenta)
ranges: 0., 0.0, 10, 20, 50, 100, 200, 9999
Landslides are indicated with a circular glyph
Credits
Please give credit for this item to:
NASA's Scientific Visualization Studio
-
Visualizers
-
Greg Shirah
(NASA/GSFC)

-
Alex Kekesi
(Global Science and Technology, Inc.)
- Trent L. Schindler (USRA)
- Lori Perkins (NASA/GSFC)
-
Greg Shirah
(NASA/GSFC)
-
Animator
- Horace Mitchell (NASA/GSFC)
-
Producer
- Ryan Fitzgibbons (USRA)
-
Scientists
- Dalia B Kirschbaum (NASA/GSFC)
-
George Huffman
(NASA/GSFC)
- Gail Skofronick Jackson (NASA/GSFC)
Missions
This page is related to the following missions:Datasets used
-
Soil Moisture [GEMS]
ID: 405GEMS stands for Goddard Earth Modeling System. It is also known as the NSIPP Global Climate Model.
See all pages that use this dataset -
CPC (Climate Prediction Center) Cloud Composite
ID: 600Global cloud cover from multiple satellites
See all pages that use this dataset -
MERRA
ID: 684 -
IMERG
ID: 863This dataset can be found at: http://pmm.nasa.gov/sites/default/files/document_files/IMERG_ATBD_V4.4.pdf
See all pages that use this dataset -
Global Flood Monitoring System (GFMS)
ID: 901
Note: While we identify the data sets used on this page, we do not store any further details, nor the data sets themselves on our site.
Related
- ID: 5361
 Visualization
Alternate Versions
- ID: 12255
 Produced Video
 - ID: 12252
 Produced Video
Sources
- ID: 4439
Used as a Source In
- ID: 14617
 Produced Video
 - ID: 31139
 Hyperwall Visual
 - ID: 12583
 Produced Video
 - ID: 12254
 Produced Video
Release date
This page was originally published on Thursday, June 23, 2016.
This page was last updated on Sunday, October 6, 2024 at 10:29 PM EDT.