El Niño: Disrupting the Marine Food Web
This gallery was created for Earth Science Week 2015 and beyond. It includes a quick start guide for educators and first-hand stories (blogs) for learners of all ages by NASA visualizers, scientists and educators. We hope that your understanding and use of NASA's visualizations will only increase as your appreciation grows for the beauty of the science they portray, and the communicative power they hold. Read all the blogs and find educational resources for all ages at: the Earth Science Week 2015 page.
In case you haven’t heard, El Niño is starting to make headlines this year. Often nicknamed "the bad boy of weather," who is this guy?
A long time ago, fishermen off the west coast of South America — one of the world's most productive fisheries — noticed that some years the fish disappeared. This was especially noticeable around Christmas time — giving it the name El Niño, which means Christ child in Spanish. Today we know why El Niño happens — but knowing when it will happen is still a challenge.
Normally, winds blow from east to west along the equator, pushing surface water westward. As the water moves away from the east, nutrient-rich deeper ocean water rises to fill the void (called upwelling.) When nutrients rise into sunlight, they cause blooms of tiny plants called phytoplankton. These plants feed the entire marine food web from small fish such as sardines to bigger fish, sea birds, and marine mammals.
When an El Niño develops, the normal east-to-west winds die and warm surface water from the west Pacific moves eastward. This stops the upwelling in the east. Without the supply of deeper, nutrient-rich water, less phytoplankton bloom and the fisheries collapse. From satellites in space we see how these changes impact the ocean’s color. Normally, the ocean looks more green along the equator (image below, left.) During El Niño, the ocean looks more blue and less green because there is less plant life (images below, right.) While this color change is subtle to our eyes, it means life or death for the species that depend upon plankton for food. Some animals starve (e.g. sea lions, marine iguanas, Galapagos penguins) while others move away to look for food elsewhere.
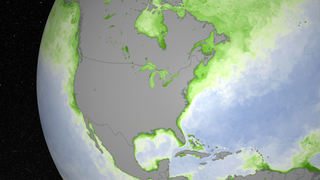
 is compared to the El Niño developing during September, 2015 (right). (Source: http://climatebits.org)")
The MODIS instrument on the Aqua satellite has been monitoring the color of the ocean's reflected light since 2002 to determine where plant life is photosynthesizing. A normal year (left) is compared to the El Niño developing during September, 2015 (right). (Source: http://climatebits.org)
In addition to disrupting the marine food web and reducing the fish catch in the Pacific, El Niño is linked to unusual weather around the world: more typhoons in the Pacific, fewer hurricanes in the Atlantic, more rain in California, less rain in Southeast Asia and Australia, and warmer weather in South America.
The monstrous 1997/98 El Niño led to extreme events with catastrophic consequences. There were floods and landslides in some places and extreme drought in others. This is how El Niño got his reputation as a "bad boy." We still can’t predict El Niño more than a few months in advance and won't know its full strength until it peaks around December, but this year’s El Niño is shaping up to be a bully.
As a scientist, I've been studying the interaction of physical oceanography and biology over long time scales (decades and more.) I also create a series of short visualizations called ClimateBits that play on Science On a Sphere displays at museums and science centers. Here's one I made about El Niño using chlorophyll images (from the MODIS sensor onboard the Aqua satellite) and sea-surface temperatures (from NOAA AVHRR and NASA AMSR-E satellites and oceanic buoy measurements.)
To give background on motion in the ocean that is key to this story, I start the piece with one of my favorite visualizations by the NASA Scientific Visualization Studio showing output from an ocean circulation model color coded with sea surface temperatures.
To see it on YouTube and for more information about El Niño and other Earth science concepts, visit: http://climatebits.org.
-- Stephanie Schollaert Uz, PhD, NASA GSFC, Earth Sciences Division, Ocean Ecology Lab

Dr. Stephanie Schollaert Uz earned her PhD from the Atmospheric and Oceanic Sciences Department at the University of Maryland and her MS in physical oceanography from the University of Rhode Island. Her research focuses on the impact of physical forcing on biology in the ocean. When she’s not working, Stephanie loves to spend time outside with her family and friends: gardening, running, biking and visiting the ocean.
For More Information
Credits
Please give credit for this item to:
NASA's Scientific Visualization Studio
-
Author
- Stephanie Uz (Global Science and Technology, Inc.)
-
Project support
- Leann Johnson (Global Science and Technology, Inc.)
Related
- ID: 12176
 Produced Video
Release date
This page was originally published on Tuesday, October 13, 2015.
This page was last updated on Wednesday, May 3, 2023 at 1:49 PM EDT.