Flat Globe: Showing the Changing Seasons
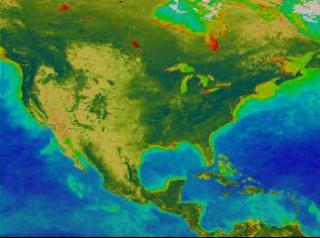
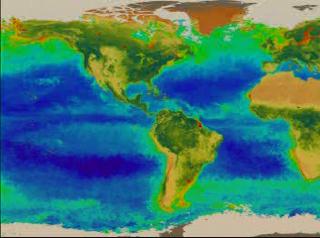
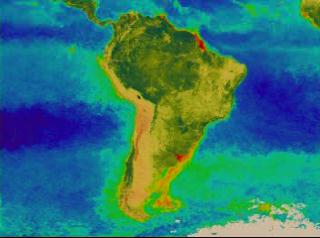
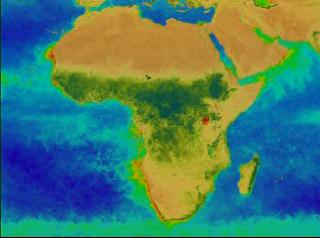
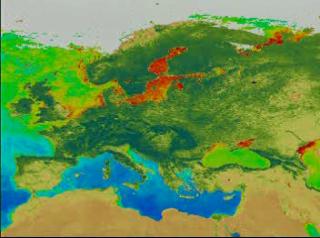
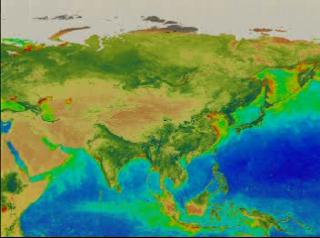
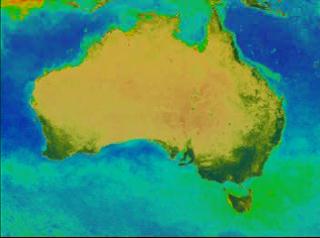
SeaWiFS false color data showing seasonal change in the oceans and on land for the entire globe. The data is seasonally averaged, and shows the sequence: fall, winter, spring, summer, fall, winter, spring (for the Northern Hemisphere).

Video slate image reads "Flat Globe Showing the Changing Seasons".
Credits
Please give credit for this item to:
NASA/Goddard Space Flight Center, The SeaWiFS Project and GeoEye, Scientific Visualization Studio. NOTE: All SeaWiFS images and data presented on this web site are for research and educational use only. All commercial use of SeaWiFS data must be coordinated with GeoEye (NOTE: In January 2013, DigitalGlobe and GeoEye combined to become DigitalGlobe).
-
Animators
- Jesse Allen (Raytheon)
- Marte Newcombe (Global Science and Technology, Inc.)
-
Scientist
- Gene Feldman (NASA/GSFC)
Series
This page can be found in the following series:Datasets used
-
Global Biosphere [SeaStar: SeaWiFS]
ID: 467SeaWiFS Global Biosphere is a combination of the Land NDVI and Chlorophyll Concentration data sets. All SeaWiFS images and data presented on this web site are for research and educational use only. All commercial use of SeaWiFS data must be coordinated with GeoEye.
Credit: NASA/Goddard Space Flight Center, The SeaWiFS Project and GeoEye, Scientific Visualization Studio. NOTE: All SeaWiFS images and data presented on this web site are for research and educational use only. All commercial use of SeaWiFS data must be coordinated with GeoEye (NOTE: In January 2013, DigitalGlobe and GeoEye combined to become one DigitalGlobe.).
This dataset can be found at: http://oceancolor.gsfc.nasa.gov/PRODUCTS/
See all pages that use this dataset
Note: While we identify the data sets used on this page, we do not store any further details, nor the data sets themselves on our site.
Alternate Versions
- ID: 436

- ID: 437
 Visualization
 - ID: 438
 Visualization
 - ID: 439
 Visualization
 - ID: 440
 Visualization
 - ID: 441
 Visualization
 - ID: 442
 Visualization
 - ID: 443
 Visualization
Release date
This page was originally published on Wednesday, September 9, 1998.
This page was last updated on Wednesday, May 3, 2023 at 1:59 PM EDT.