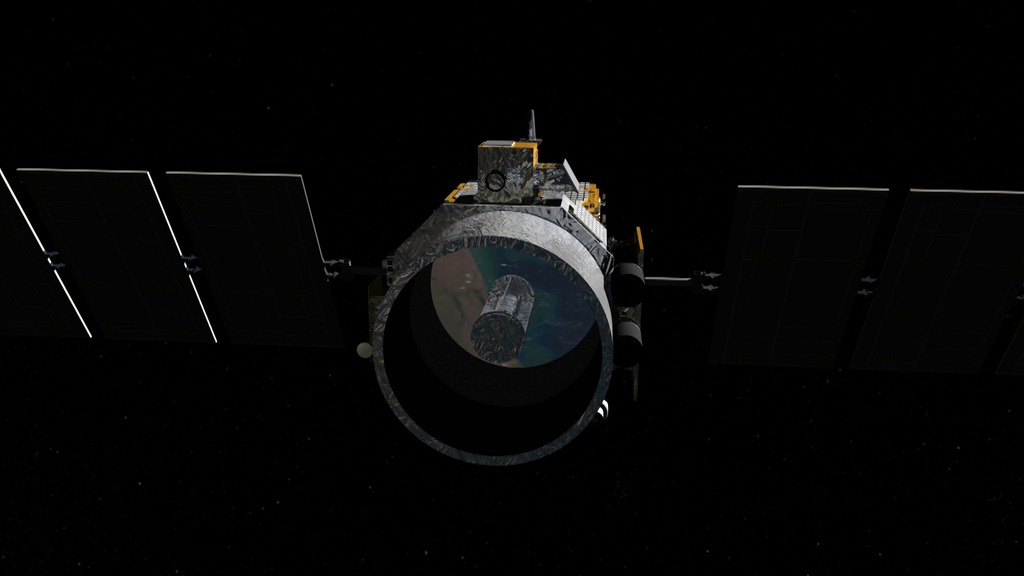
CALIPSO observes Saharan dust crossing the Atlantic Ocean
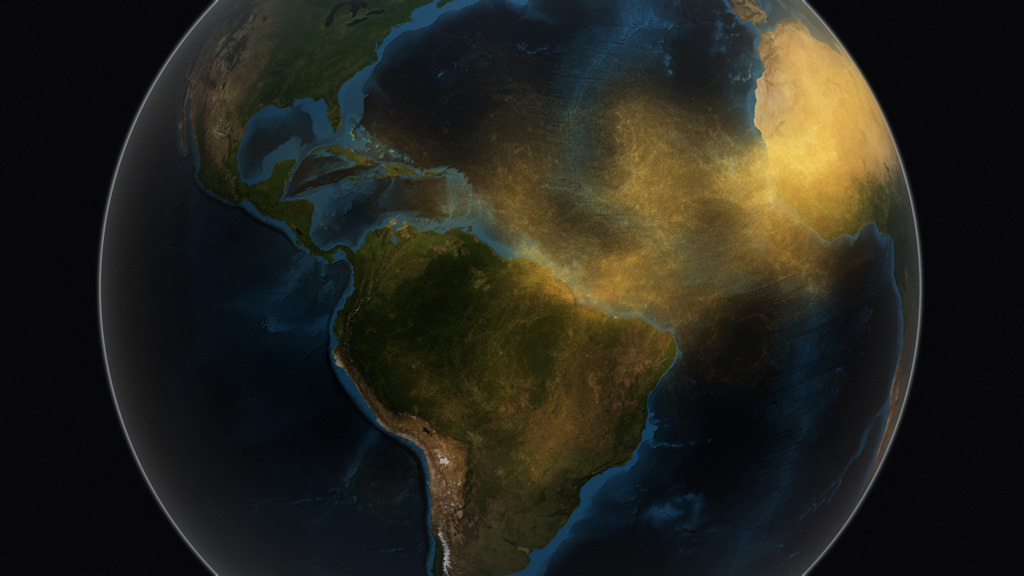
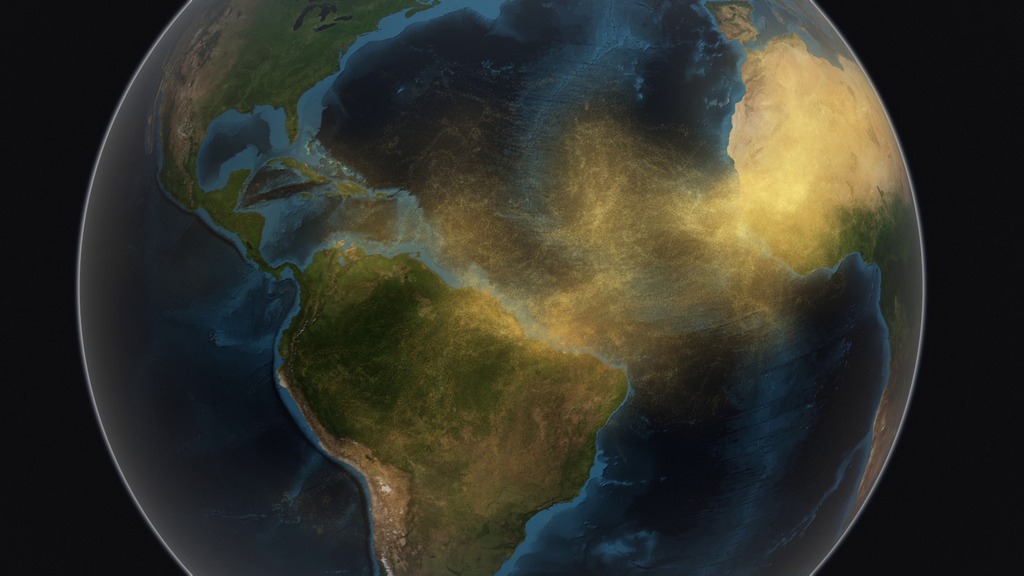
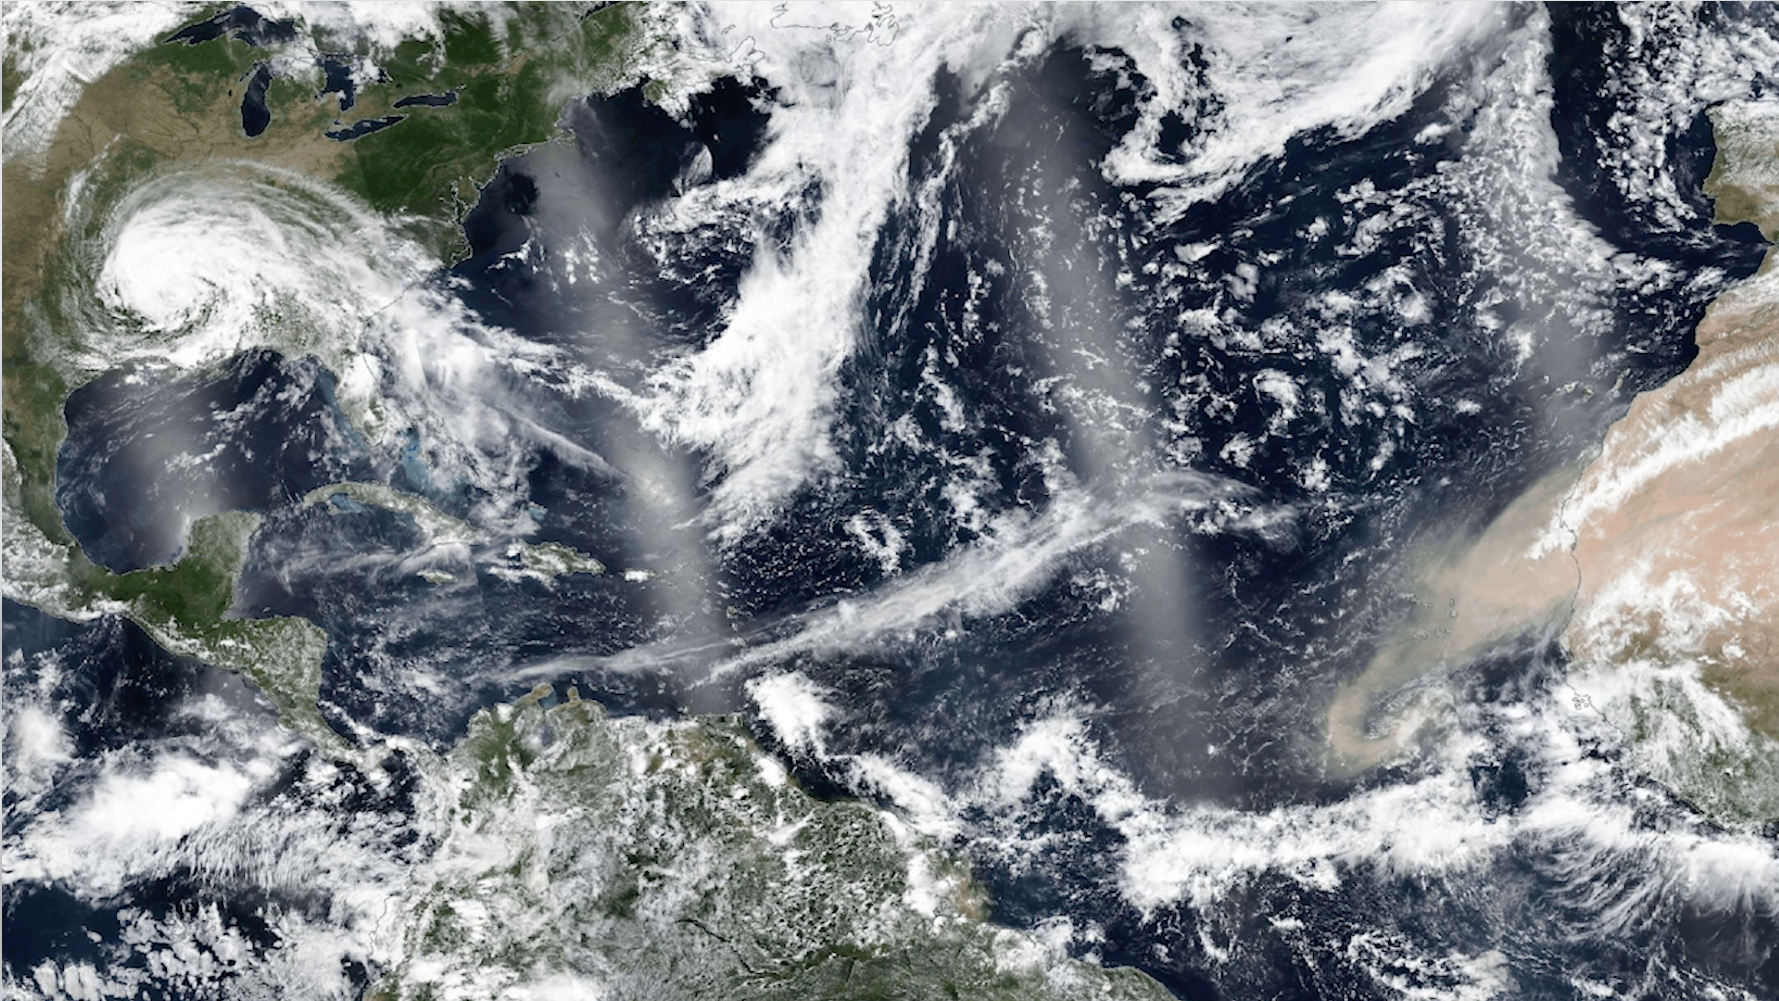
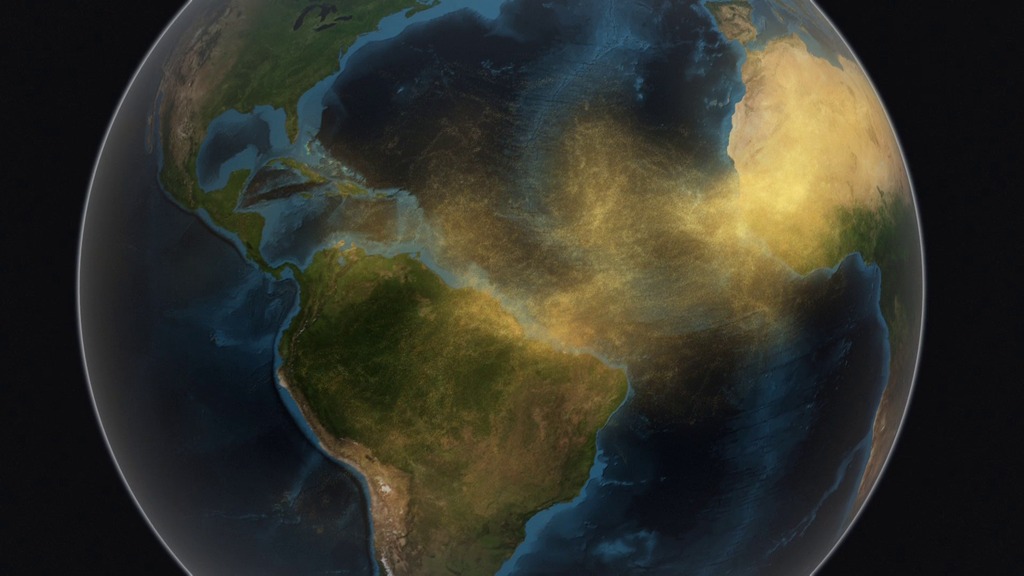
Subtitled visualization depicting Saharan dust travelling across the Atlantic Ocean to the Amazon Basin. MODIS imagery shows a 2D representation of the dust cloud, which is then compared to CALIPSO data curtains showing dust throughout the air column. Seasonal dust flux measurements are visualized using particles systems. Finally, average annual dust deposition into the Amazon Basin is shown by Amazon boundary import/export measurements.
For the first time, a NASA satellite has quantified in three dimensions how much dust makes the trans-Atlantic journey from the Sahara Desert the Amazon rainforest. Among this dust is phosphorus, an essential nutrient that acts like a fertilizer, which the Amazon depends on in order to flourish.
The new dust transport estimates were derived from data collected by a lidar instrument on NASA's Cloud-Aerosol Lidar and Infrared Pathfinder Satellite Observation, or CALIPSO, satellite from 2007 though 2013.
The data show that wind and weather pick up on average 182 million tons of dust each year and carry it past the western edge of the Sahara at longitude 15W. This volume is the equivalent of 689,290 semi trucks filled with dust. The dust then travels 1,600 miles across the Atlantic Ocean, though some drops to the surface or is flushed from the sky by rain. Near the eastern coast of South America, at longitude 35W, 132 million tons remain in the air, and 27.7 million tons – enough to fill 104,908 semi trucks – fall to the surface over the Amazon basin. About 43 million tons of dust travel farther to settle out over the Caribbean Sea, past longitude 75W.
Dust collected from the Bodélé Depression and from ground stations on Barbados and in Miami give scientists an estimate of the proportion of phosphorus in Saharan dust. This estimate is used to calculate how much phosphorus gets deposited in the Amazon basin from this dust transport, an estimated 22,000 tons per year.
The finding is part of a bigger research effort to understand the role of dust and aerosols in the environment and on local and global climate.
(NO subtitles) Visualization depicting Saharan dust travelling across the Atlantic Ocean to the Amazon Basin. MODIS imagery shows a 2D representation of the dust cloud, which is then compared to CALIPSO data curtains showing dust throughout the air column. Seasonal dust flux measurements are visualized using particles systems. Finally, average annual dust deposition into the Amazon Basin is shown by Amazon boundary import/export measurements.
This video is also available on our YouTube channel.
Saharan Dust - 2010 transport event visualized using CALIPSO data curtains
Closeup of CALIPSO data curtains showing Saharan dust in the atmosphere

Print resolution still of CALIPSO data curtains depicting dust in the atmosphere, shown in a flat map projection. Each curtain represents one pass of the satellite between 3/16/2010 and 4/2/2010. (The rightmost curtain is 3/16/2010 and the leftmost curtain is 4/2/2010)

Print resolution still of dust routes that were back-propagated from Barbados (red) and Cayenne (green). The purpose of this analysis was to determine where the dust observed in these two locations came from. (NOTE - This image depicts dust that started in Africa and ended in Barbados and Cayenne).

Print resolution still that compares seven days of CALIPSO data (from 3/25/2010 to 4/2/2010) with two sets of back-propagated dust routes over the same period. (NOTE - Routes depict dust that started in Africa and ended in Barbados and Cayenne)
This visualization compares seven days of CALIPSO data (from 3/25/2010 to 4/2/2010) with two sets of back-propagated dust routes over the same period. Markers along the routes represent 24hr intervals. NOTE - Routes depict dust that started in Africa and ended in Barbados(red) and Cayenne(green).
This visualization compares seven days of CALIPSO data (from 3/25/2010 to 4/2/2010) with two sets of back-propagated dust routes over the same period. Markers along the routes represent 24hr intervals. NOTE - Routes depict dust that started in Africa and ended in Barbados(red) and Cayenne(green). Time is running backwards in this visualization.

This image compares seven days of CALIPSO data (from 3/25/2010 to 4/2/2010) with two sets of back-propagated dust routes over the same period. Markers along the routes represent 24hr intervals. NOTE - Routes depict dust that started in Africa and ended in Barbados(B) and Cayenne(C)

Print resolution still (NO labels) that compares seven days of CALIPSO data (from 3/25/2010 to 4/2/2010) with two sets of back-propagated dust routes over the same period. Markers along the routes represent 24hr intervals. (NOTE - Routes depict dust that started in Africa and ended in Barbados and Cayenne)
Satellite imagery showing Saharan dust off the coast of Africa (Suomi NPP VIIRS instrument)
Satellite imagery showing Saharan dust reaching South America (Suomi NPP VIIRS instrument)

Print resolution still of MODIS imagery showing dust off the coast of Africa on a 3D globe

Print resolution still of MODIS imagery showing dust off the coast of Africa on a 3D globe

Print resolution still comparing MODIS imagery and CALIPSO curtain showing dust off the coast of Africa on a 3D globe
For More Information
Credits
Please give credit for this item to:
NASA's Scientific Visualization Studio
-
Animators
-
Kel Elkins
(USRA)
-
Greg Shirah
(NASA/GSFC)
- Horace Mitchell (NASA/GSFC)
-
Kel Elkins
(USRA)
-
Producer
- Joy Ng (USRA)
-
Scientist
- Hongbin Yu (JCET UMBC)
-
Science writer
- Ellen T. Gray (ADNET Systems, Inc.)
-
Project support
- Ian Jones (ADNET Systems, Inc.)
- Laurence Schuler (ADNET Systems, Inc.)
-
Graphics
- Norman Kuring (NASA/GSFC)
Missions
This page is related to the following missions:Series
This page can be found in the following series:Datasets used
-
[CALIPSO: CALIOP]
ID: 178Cloud-Aerosol Lidar with Orthogonal Polarization
See all pages that use this dataset
Note: While we identify the data sets used on this page, we do not store any further details, nor the data sets themselves on our site.
Release date
This page was originally published on Tuesday, February 24, 2015.
This page was last updated on Sunday, January 5, 2025 at 10:43 PM EST.
