Solar Dynamics Observatory - Argo view - Slices of SDO
Argos (or Argus Panoptes) was the 100-eyed giant in Greek mythology (wikipedia).
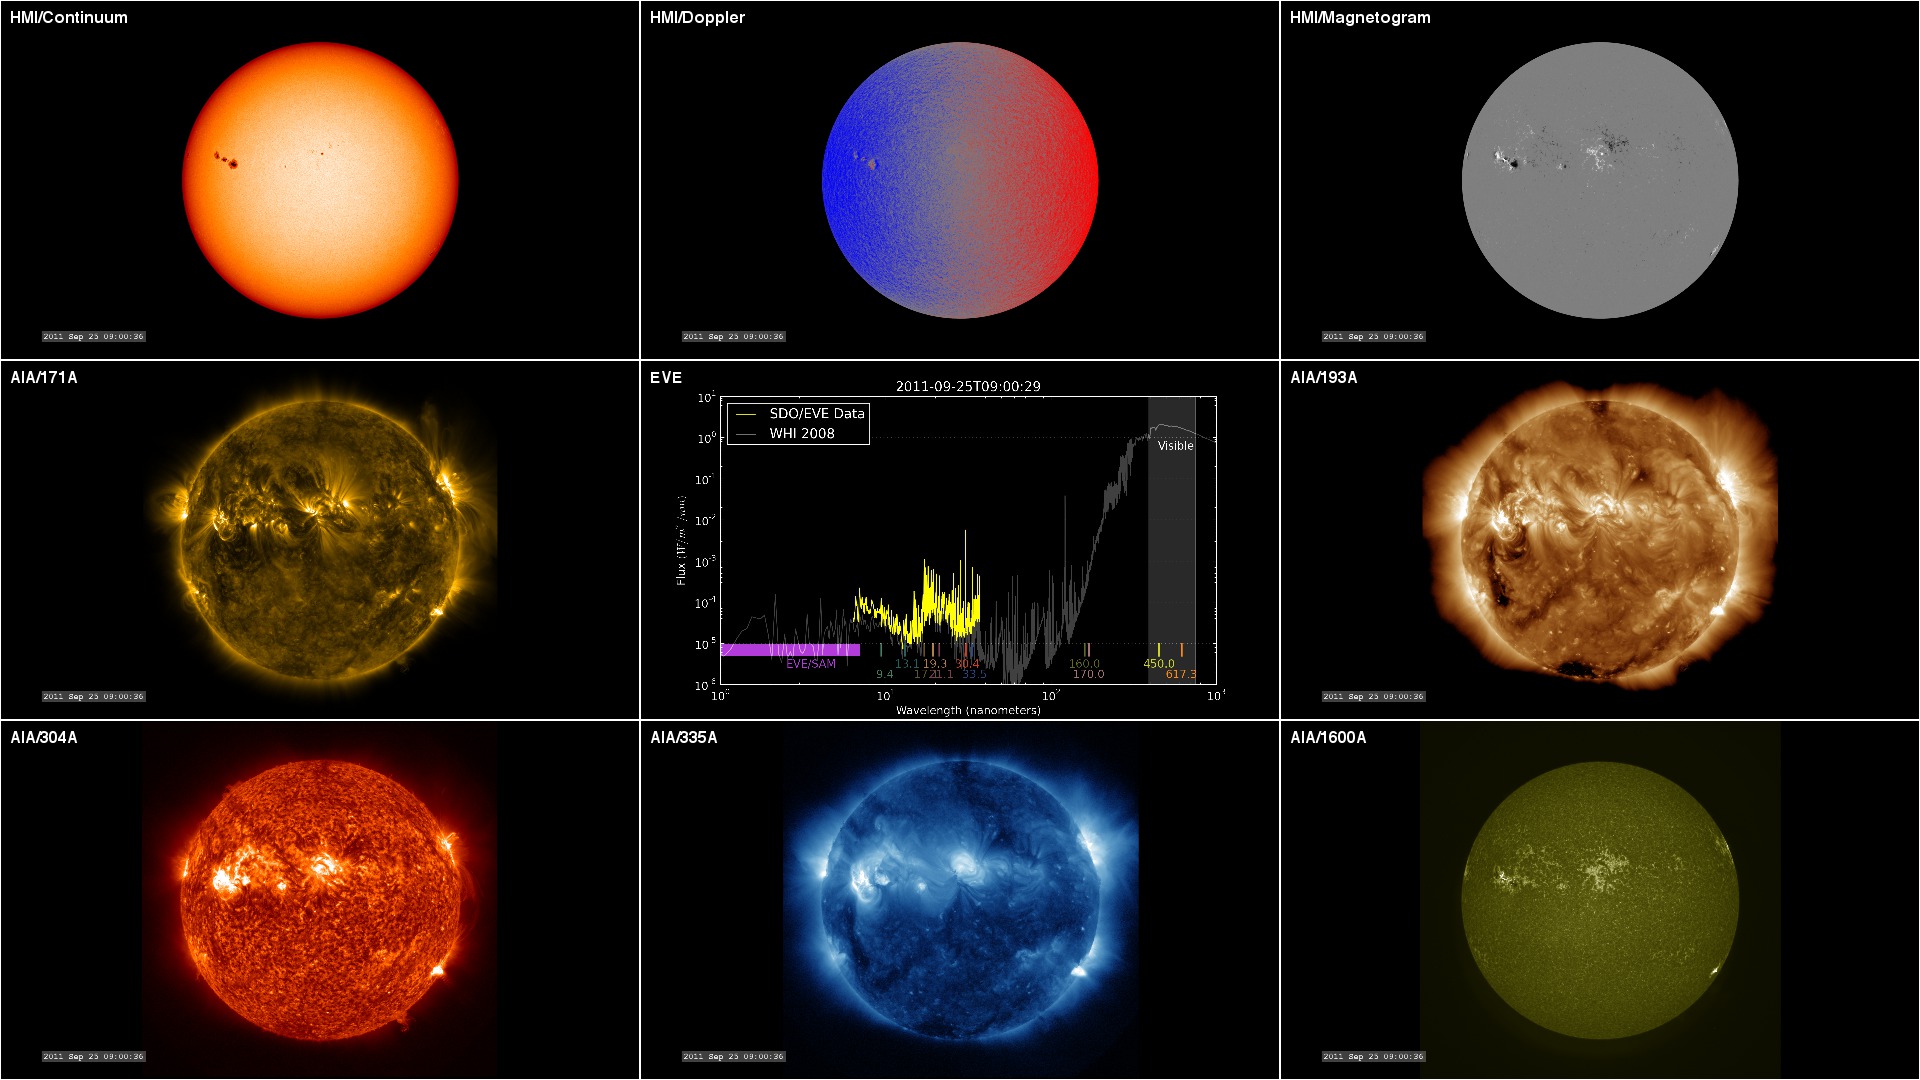
While the Solar Dynamics Observatory (SDO) has significantly less than 100 eyes, (see "SDO Jewelbox: The Many Eyes of SDO"), seeing connections in the solar atmosphere through the many filters of SDO presents a number of interesting challenges. This visualization experiment illustrates a mechanism for highlighting these connections.
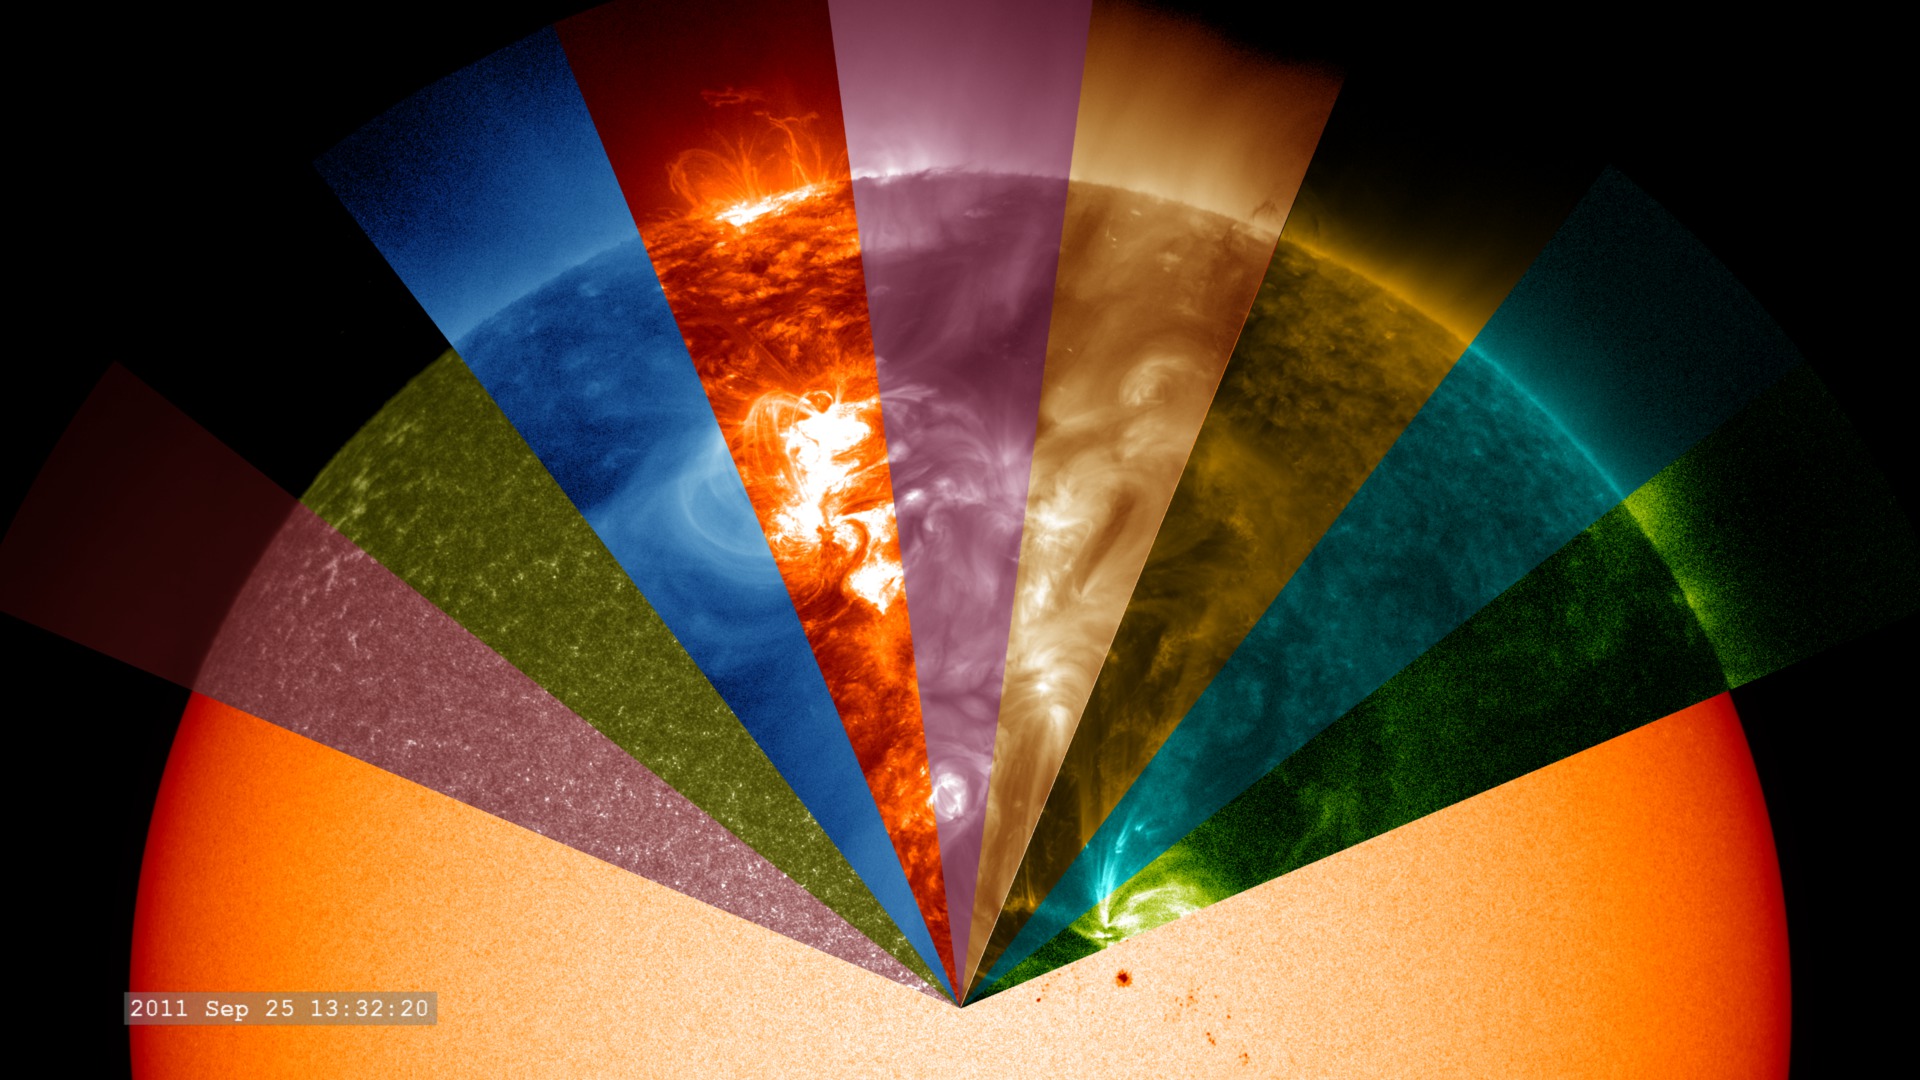
This visualization is a variation of the original Solar Dynamics Observatory - Argo view. In this case, the different wavelength filters are presented in three sets around the Sun at full 4Kx4K resolution. This enables monitoring of changes in time over all wavelengths at any location around the limb of the Sun.
The wavelengths presented are: 617.3nm optical light from SDO/HMI. From SDO/AIA we have 170nm (pink), then 160nm (green), 33.5nm (blue), 30.4nm (orange), 21.1nm (violet), 19.3nm (bronze), 17.1nm (gold), 13.1nm (aqua) and 9.4nm (green).
We've locked the camera to rotate the view of the Sun so each wedge-shaped wavelength filter passes over a region of the Sun. As the features pass from one wavelength to the next, we can see dramatic differences in solar structures that appear in different wavelengths.
- Filaments extending off the limb of the Sun which are bright in 30.4 nanometers, appear dark in many other wavelengths.
- Sunspots which appear dark in optical wavelengths, are festooned with glowing ribbons in ultraviolet wavelengths.
- small flares, invisible in optical wavelengths, are bright ribbons in ultraviolet wavelengths.
- if we compare the visible light limb of the Sun with the 170 nanometer filter on the left, with the visible light limb and the 9.4 nanometer filter on the right, we see that the 'edge' is at different heights. This effect is due to the different amounts of absorption, and emission, of the solar atmosphere in ultraviolet light.
- in far ultraviolet light, the photosphere is dark since the black-body spectrum at a temperature of 5700 Kelvin emits very little light in this wavelength.
1/4 resolution full-disk movie illustrating how the different wavelength filters move around the solar image.

Composited 4Kx4K frames of the different wavelengths, rendered at native SDO resolution. These frames are useful for easy movies of cropped views centered on specific features.
A graphical key to the wavelengths of each part of the image. Note that this key maps the dominant color table to the wavelength, not the position in the graphic.
Cropped version of the SDO animation, preserving the native resolution of the original data but only showing the bottom part of the sun's disk.
From animation 4009, a map identifying the wavelength locations of the various filters in the solar spectrum.
Credits
Please give credit for this item to:
NASA's Goddard Space Flight Center Scientific Visualization Studio, the SDO Science Team, and the Virtual Solar Observatory.
-
Animator
- Tom Bridgman (Global Science and Technology, Inc.)
-
Scientists
- William D. Pesnell (NASA/GSFC)
- Barbara Thompson (NASA/GSFC)
- C. Alex Young (NASA/GSFC)
Missions
This page is related to the following missions:Series
This page can be found in the following series:Datasets used
-
SDO Continuum (Continuum) [SDO: HMI]
ID: 674 -
AIA 304 (304 Filter) [SDO: AIA]
ID: 677This dataset can be found at: http://jsoc.stanford.edu/
See all pages that use this dataset -
AIA 211 (211 Filter) [SDO: AIA]
ID: 678This dataset can be found at: http://jsoc.stanford.edu/
See all pages that use this dataset -
AIA 193 (193 Filter) [SDO: AIA]
ID: 679This dataset can be found at: http://jsoc.stanford.edu/
See all pages that use this dataset -
AIA 171 (171 Filter) [SDO: AIA]
ID: 680This dataset can be found at: http://jsoc.stanford.edu/
See all pages that use this dataset -
AIA 1700 (1700 Filter) [SDO: AIA]
ID: 710This dataset can be found at: http://jsoc.stanford.edu/
See all pages that use this dataset -
AIA 131 (131 Filter) [SDO: AIA]
ID: 730This dataset can be found at: http://jsoc.stanford.edu/
See all pages that use this dataset -
AIA 335 (335 Filter) [SDO: AIA]
ID: 748This dataset can be found at: http://jsoc.stanford.edu/
See all pages that use this dataset -
AIA 94 (94 Filter) [SDO: AIA]
ID: 749This dataset can be found at: http://jsoc.stanford.edu/
See all pages that use this dataset -
AIA 1600 (1600 Filter) [SDO: AIA]
ID: 757This dataset can be found at: http://jsoc.stanford.edu/
See all pages that use this dataset
Note: While we identify the data sets used on this page, we do not store any further details, nor the data sets themselves on our site.
Related
- ID: 4117
 Visualization
 - ID: 4008
 Visualization
Release date
This page was originally published on Tuesday, December 24, 2013.
This page was last updated on Wednesday, June 10, 2026 at 10:26 AM EDT.