Global Hawk observes the Saharan Air Layer through the Cloud Physics Lidar (CPL) during Hurricane Nadine
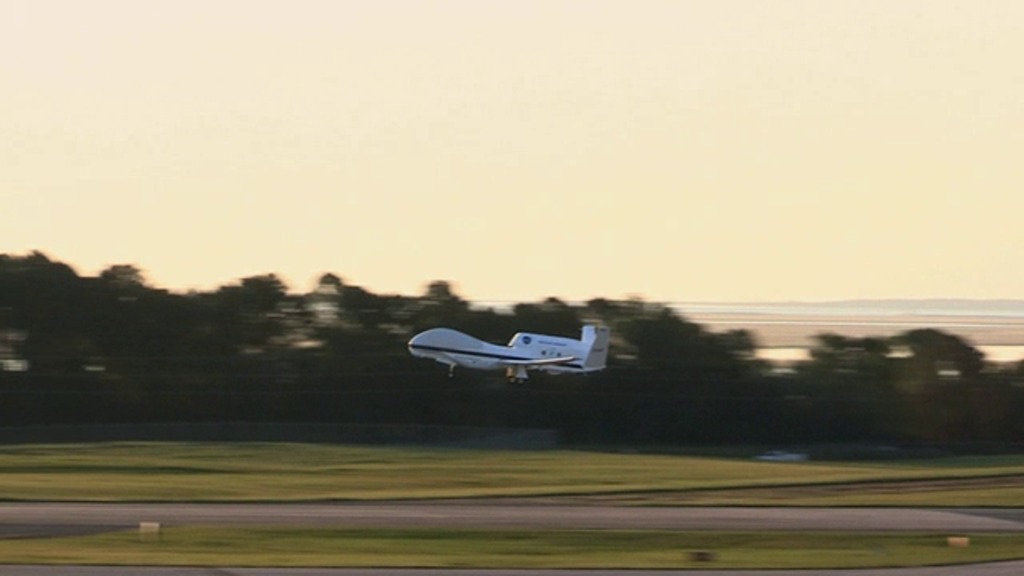
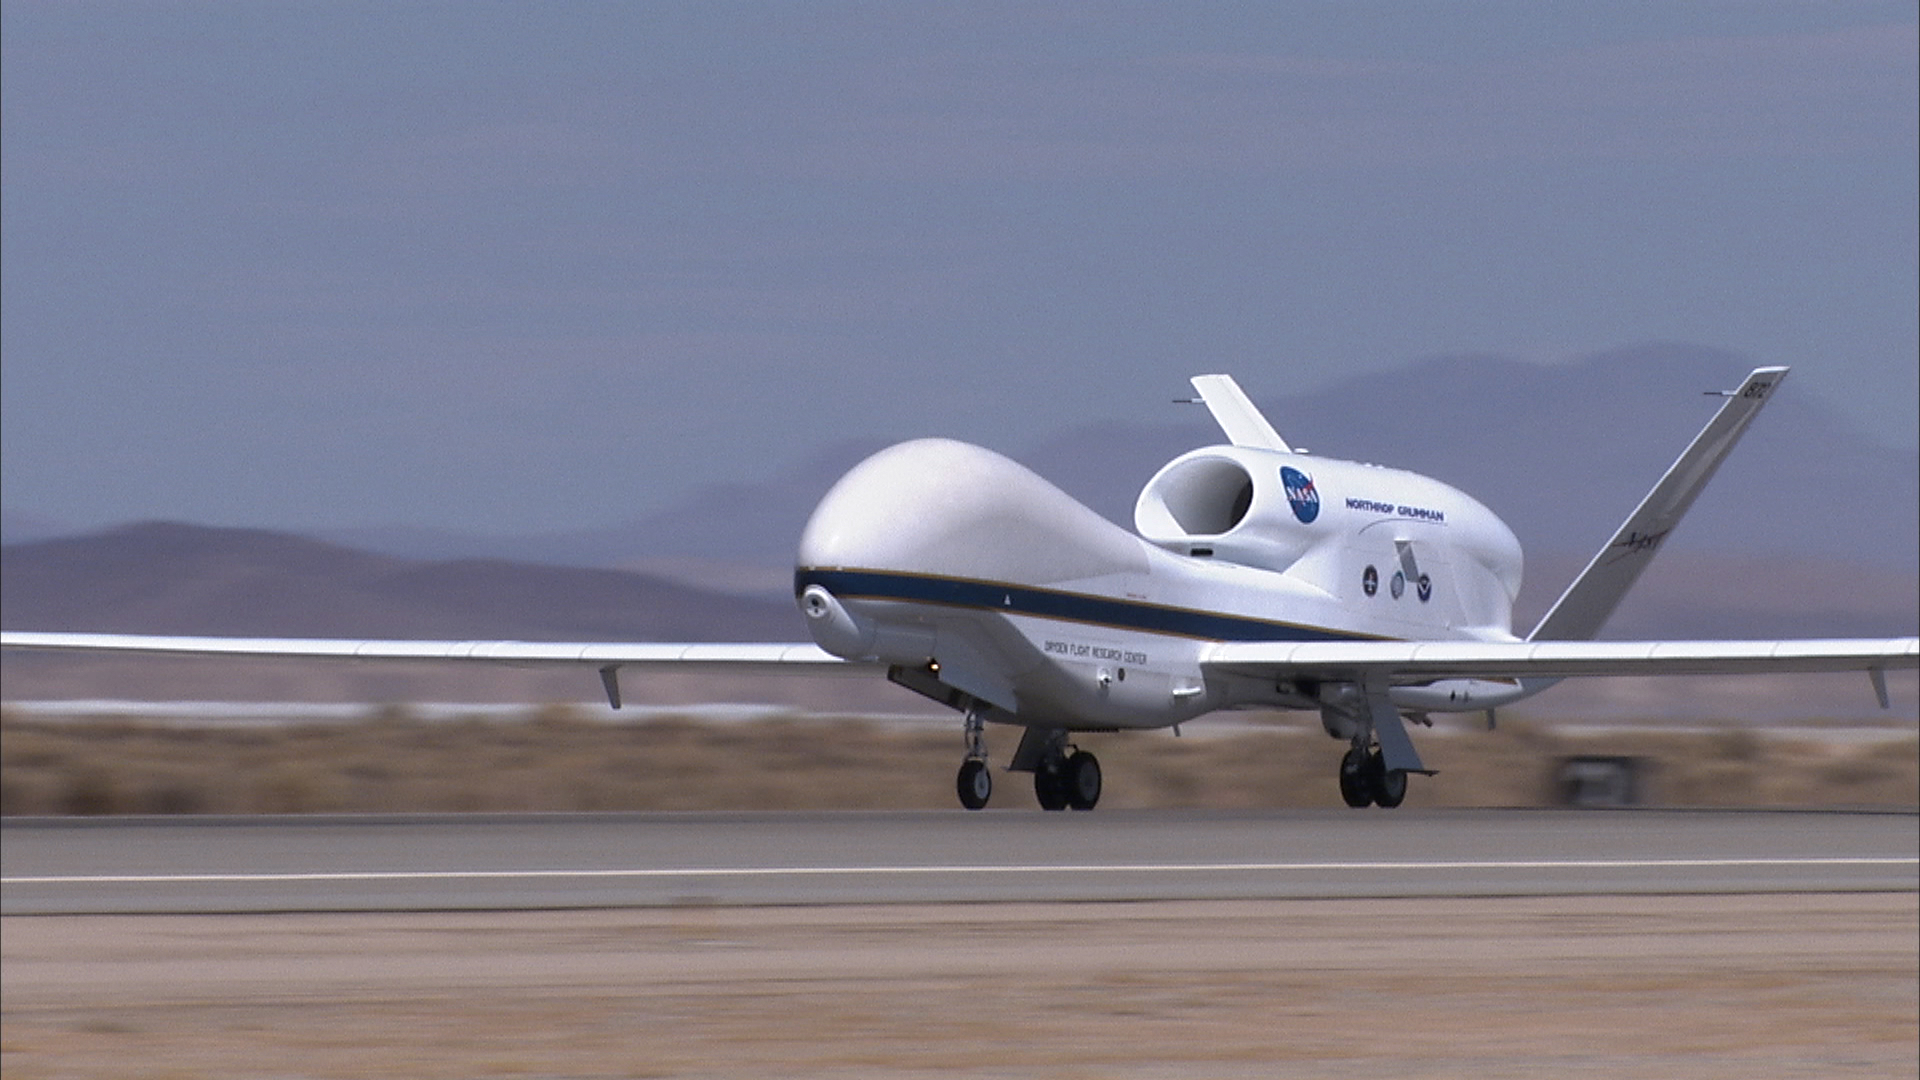
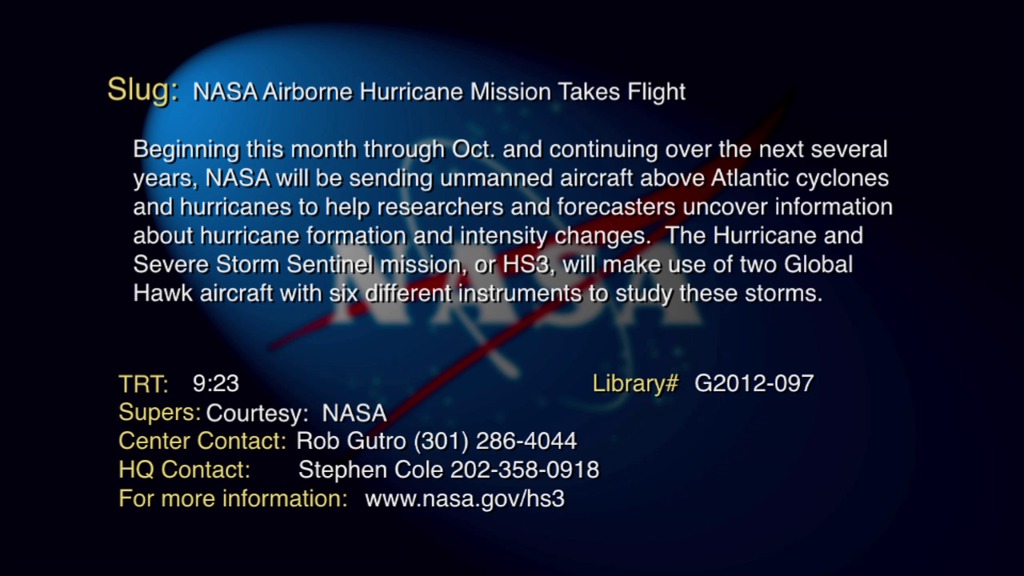
NASA's Hurricane and Severe Storm Sentinel mission(HS3) is a mission that brings together several NASA centers with federal and university partners to investigate the processes that underlie hurricane formation and intensity change in the Atlantic Ocean basin. Among those factors, HS3 will address the controversial role of the hot, dry and dusty Saharan Air Layer(SAL) in tropical storm formation and intensification and the extent to which deep convection in the inner-core region of storms is a key driver of intensity change.
One instrument used to investigate the SAL is the cloud physics lidar(CPL). CPL uses a laser to measure vertical profiles of dust; a dropsonde system that releases small instrumented packages from the aircraft that fall to the surface while measuring profiles of temperature, humidity, and winds; and an infrared sounder that measures temperature and humidity in clear-sky regions.The CPL is an airborne lidar system designed specifically for studying clouds and aerosols. CPL will study cloud- and dust-layer boundaries and will provide optical depth or thickness of aerosols and clouds
On Sept. 11 and 12, during the 2012 HS3 mission, the NASA Global Hawk aircraft covered more than one million square kilometers (386,100 square miles) going back and forth over the storm in a gridded fashion in what's called a "lawnmower pattern."
Dropsonde data from HS3's flights show temperature and humidity conditions in the storm. In this movie, the dropsondes are colored with the relative humidity data where blue represents dry air and red represents moist air.
For more information about NASA's HS3 mission, visit:
This animation shows how NASA scientists investigated the Saharan Air Layer during Hurricane Nadine. The blue to white data in the curtains is attenuated backscatter from CPL. The dropsonde data is showing relative humidity where blue represents dry air and red represents moist air.

September 11/12 flights with backscatter and dropsondes showing relative humidity
September 14/15 flight with CPL and relative humidity
September 19/20 flight
September 22/23 flights
This frame sequence has the CPL backscatter data without the dropsondes.
This frame sequence contains just the dropsonde geometry colored by the relative humidity data.
Areas in blue are dry and red are moist.
Relative Humidity measured from the dropsondes

CPL Attenuated Backscatter at 532 nm

Dust localities in the CPL backscatter are highlighted
in orange.

Sep 11/12 flight label

Sep 14/15 flight label

Sep 19 flight label

Sep 22 flight label
This is the hyperwall 6840 by 2304 frame set of this movie. It was rendered to be displayed on a 5 column by 3 row hyperwall, but it may be shown on a 3 column by 3 row hyperwall as well.
Credits
Please give credit for this item to:
NASA/Goddard Space Flight Center
Scientific Visualization Studio
-
Animators
- Lori Perkins (NASA/GSFC)
-
Greg Shirah
(NASA/GSFC)

-
Producer
- Rob Gutro (NASA/GSFC)
-
Scientists
- Scott Braun (NASA/GSFC)
- Dennis L. Hlavka (SSAI)
Series
This page can be found in the following series:Datasets used
-
CPL (Attenuated Backscatter) [Global Hawk: Cloud Physics Lidar]
ID: 799 -
Relative Humidity [Global Hawk: Dropsondes]
ID: 800 -
Temperature Anomalies [Global Hawk: Dropsondes]
ID: 801
Note: While we identify the data sets used on this page, we do not store any further details, nor the data sets themselves on our site.
Related
- ID: 11657
 Produced Video
 - ID: 11505
 Produced Video
 - ID: 11039
 Produced Video
Release date
This page was originally published on Tuesday, September 10, 2013.
This page was last updated on Sunday, February 2, 2025 at 10:12 PM EST.