IRIS First Light: The View from SDO/AIA @ 160 nm
Contemporaneous views of the Sun from SDO. Used in support of the IRIS First Light release.
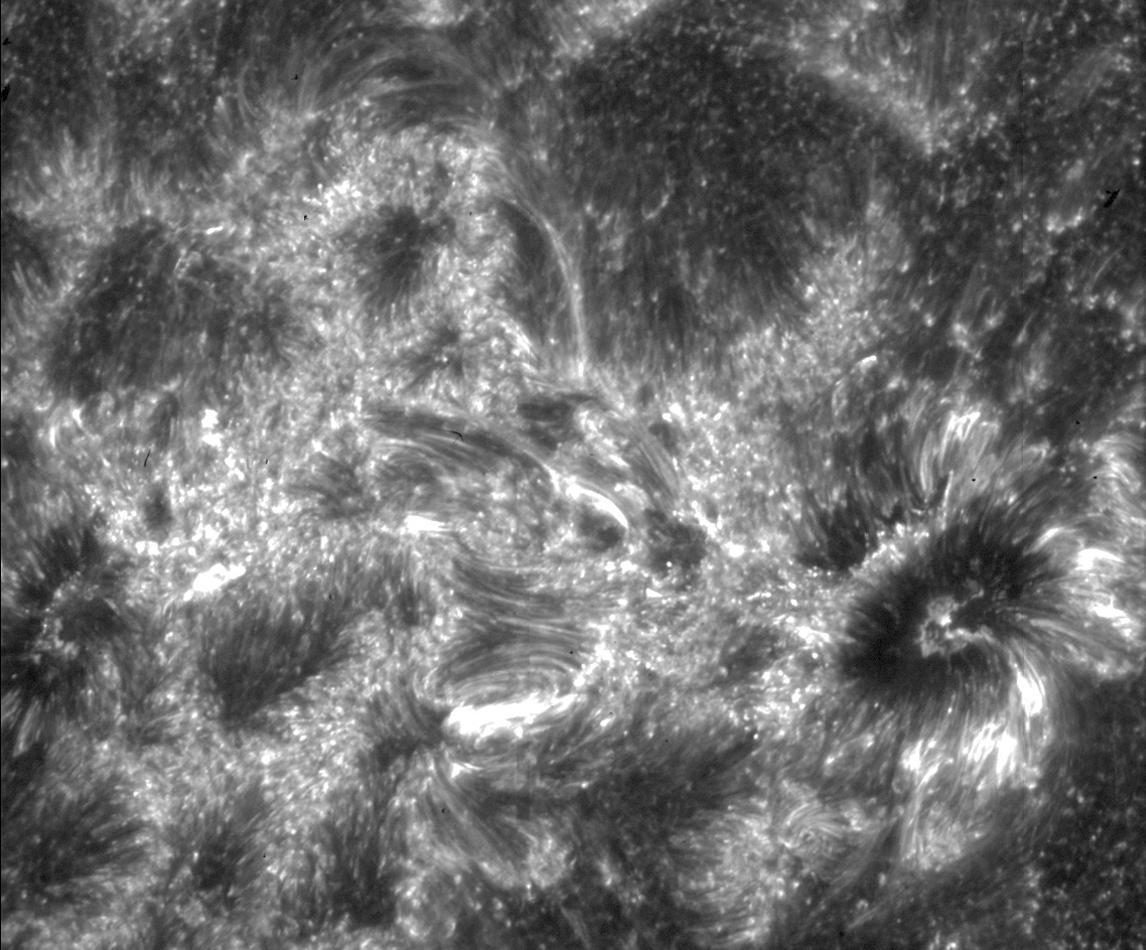
Full disk view of the Sun in the 160 nanometer wavelength.
This movie zooms into the region of the Sun imaged by IRIS.
Credits
Please give credit for this item to:
NASA's Goddard Space Flight Center Scientific Visualization Studio, the SDO Science Team, and the Virtual Solar Observatory.
-
Animator
- Tom Bridgman (Global Science and Technology, Inc.)
-
Producer
- Genna Duberstein (USRA)
-
Scientist
- Alan Title (LMSAL)
Missions
This page is related to the following missions:Datasets used
-
AIA 1600 (1600 Filter) [SDO: AIA]
ID: 757This dataset can be found at: http://jsoc.stanford.edu/
See all pages that use this dataset
Note: While we identify the data sets used on this page, we do not store any further details, nor the data sets themselves on our site.
Related
- ID: 11314
 Produced Video
Release date
This page was originally published on Thursday, July 25, 2013.
This page was last updated on Wednesday, May 3, 2023 at 1:51 PM EDT.