Antarctic Bedrock
Above: Move bar to compare the bedrock topography (left) to the ice sheet surface (right).Download HTML to embed this in your web page.
The topography of the bedrock under the Antarctic Ice Sheet is critical to understanding the dynamic motion of the ice sheet, its thickness and its influence on the surrounding ocean and global climate. In 2001, the British Antarctic Survey (BAS) released a map of the bed under the Antarctic Ice Sheet and the seabed extending out on to the continental shelf derived from data collected by an international consortium of scientists over the prior fifty years. The resulting dataset was called BEDMAP (or BEDMAP1). In 2013, BAS released an update of the topographic dataset called BEDMAP2 that incorporates twenty-five million measurements taken over the past two decades from the ground, air and space. This visualization compares the new BEDMAP2 dataset to the original BEDMAP1 dataset showing the improvements in resolution and coverage.
Above: Move bar to compare the Bedmap1 topography (left) to the Bedmap2 topography (right). Download HTML to embed this in your web page.
Since 2009, NASA's mission Operation IceBridge (OIB) has flown aircraft over the Antarctic Ice Sheet carrying laser and ice-penetrating radar instruments to collect data about the surface height, bedrock topography and ice thickness. This visualization highlights the contribution that OIB has made to this important dataset. The topography in this visualization is exaggerated to emphasize the topographic relief. The amount of exaggeration varies based on the viewpoint, from twenty times in distant views down to nine times when near the Pine Island Bay.
The complete narrated animation with labels and flight paths.
Complete transcript available.
This video is also available on our YouTube channel.
The Earth layer of the animation with transparency but without text labels or the star background.
The star background.
The labels with transparency.

A print resolution still image of Antarctica with flow lines showing the motion of the ice sheet. The flow lines are colored by velocity with reds indicating faster flows and blues indicating slower.
A print resolution still image of the region around Pine Island, Antarctica showing the difference between the original Bedmap1 dataset and the improved Bedmap2 dataset. Shown here with labels, a dividing wall separates the two datasets.
A print resolution still image of the region around Pine Island, Antarctica showing the difference between the original Bedmap1 dataset on the lower left and the improved Bedmap2 dataset on the upper right. Shown here without labels, a dividing wall separates the two datasets.
A print resolution still image showing the flight paths over the Pine Island region from Operation IceBridge flights in 2009, 2010 and 2011. A legend indicates the color used for each year.
A print resolution still image showing the flight paths over the Pine Island region from Operation IceBridge flights in 2009, 2010 and 2011. Green indicates 2009 flights, yellow for 2010 and orange for 2011.
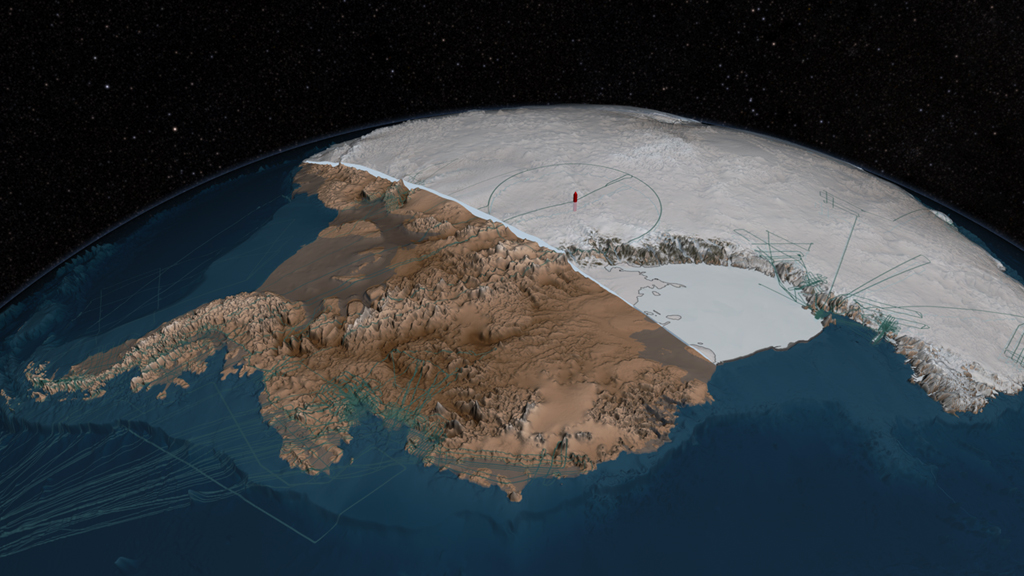
A print resolution still image showing the flight lines flown by Operation IceBridge over the surface of Antarctica. The red pole in the center represents the South Pole. The flight lines converge in Punta Arenas, Chile.
First of three co-registered images for web comparison: Bedmap1 Topography
Second of three co-registered images for web comparison: Bedmap2 Topography
Third of three co-registered images for web comparison: Bedmap2 Surface Elevation
- Antarctic Ice Sheet
- Cryology
- Cryosphere
- Earth Science
- Glacier Elevation/Ice Sheet Elevation
- Glacier Motion/Ice Sheet Motion
- Glacier Thickness/Ice Sheet Thickness
- Glacier Topography/Ice Sheet Topography
- Glaciers
- Glaciers/Ice Sheets
- HDTV
- Hydrosphere
- Hyperwall
- Ice Depth/Thickness
- Ice Motion
- Narrated
- Snow/Ice
Credits
Please give credit for this item to:
NASA's Goddard Space Flight Center Scientific Visualization Studio
-
Visualizer
-
Cindy Starr
(Global Science and Technology, Inc.)

-
Cindy Starr
(Global Science and Technology, Inc.)
-
Animators
-
Greg Shirah
(NASA/GSFC)
- Horace Mitchell (NASA/GSFC)
-
Greg Shirah
(NASA/GSFC)
-
Video editor
-
Cindy Starr
(Global Science and Technology, Inc.)
-
Cindy Starr
(Global Science and Technology, Inc.)
-
Narrator
- Jefferson Beck (USRA)
-
Producer
- Jefferson Beck (USRA)
-
Scientists
- William Krabill (NASA/GSFC Wallops)
- Eric J. Rignot (NASA/JPL CalTech)
- Peter Fretwell (British Antarctic Survey)
- H. D. Pritchard (British Antarctic Survey)
- D. G. Vaughan (British Antarctic Survey)
- J. L. Bamber (School of Geographical Sciences, University of Bristol, UK)
- N. E. Barrand (British Antarctic Survey)
- R. Bell (Lamont-Doherty Earth Observatory of Columbia University)
- C. Bianchi (Istituto Nazionale di Geofisica e Vulcanologia)
- R. G. Bingham (School of Geosciences, University of Aberdeen)
- Donald D. Blankenship (Institute for Geophysics, University of Texas at Austin)
- G. Casassa (Centro de Estudios Cientificos)
- G. Catania (Institute for Geophysics, University of Texas at Austin)
- D. Callens (Laboratoire de Glaciologie, Universit)
- H. Conway (Earth and Space Sciences, University of Washington)
- A. J. Cook (Department of Geography, Swansea University)
- H. F. J. Corr (British Antarctic Survey)
- D. Damaske (Federal Institute for Geosciences and Natural Resources)
- V. Damm (Federal Institute for Geosciences and Natural Resources)
- Fausto Ferraccioli (British Antarctic Survey)
- R. Forsberg (National Space Institute, Technical University of Denmark)
- S. Fujita (National Institute of Polar Research)
- Y. Gim (NASA/JPL CalTech)
- P. Gogineni (Electrical Engineering and Computer Science, University of Kansas)
- J. A. Griggs (School of Geographical Sciences, University of Bristol)
- R. C. A. Hindmarsh (British Antarctic Survey)
- P. Holmlund (Stockholm University)
- J. W. Holt (Institute for Geophysics, University of Texas at Austin)
- R. W. Jacobel (St. Olaf College)
- A. Jenkins (British Antarctic Survey)
- Wilfried Jokat (Alfred Wegener Institute)
- T. Jordan (British Antarctic Survey)
- E. C. King (British Antarctic Survey)
- J. Kohler (Norwegian Polar Institute, Fram Centre)
- M. Riger-Kusk (College of Science, University of Canterbury)
- K. A. Langley (Department of Geosciences, University of Oslo)
- G. Leitchenkov (Institute for Geology and Mineral Resources of the World Ocean)
- C. Leuschen (Electrical Engineering and Computer Science, University of Kansas)
- B. P. Luyendyk (Earth Research Institute, University of California, Santa Barbara)
- Kenichi Matsuoka (Norwegian Polar Institute)
- Jeremie Mouginot (University of California, Irvine)
- F. O. Nitsche (Lamont-Doherty Earth Observatory of Columbia University)
- Y. Nogi (National Institute of Polar Research)
- O. A. Nost (Norwegian Polar Institute)
- S. V. Popov (Polar Marine Geosurvey Expedition)
- D. M. Rippin (Environment Department, University of York)
- A. Rivera (Centro de Estudios Cientificos)
- J. Roberts (Department of Sustainability, Environment, Water, Population and Communities, Australian Antarctic Division)
- N. Ross (School of Geography, Politics and Sociology, Newcastle University)
- M. J. Siegert (School of Geographical Sciences, University of Bristol)
- A. M. Smith (British Antarctic Survey)
- Daniel Steinhage (Alfred Wegener Institute)
- Michael Studinger (NASA/GSFC)
- Bo Sun (Polar Research Institute of China)
- B. K. Tinto (Lamont-Doherty Earth Observatory of Columbia University)
- B. C. Welch (Alfred Wegener Institute)
- D. Wilson (Instituite for Crustal Studies, University of California)
- Duncan A. Young (Institute for Geophysics, University of Texas)
- C. Xiangbin (Polar Research Institute of China)
- A. Zirizzotti (Istituto Nazionale di Geofisica e Vulcanologia)
-
Project support
- Laurence Schuler (ADNET Systems, Inc.)
- Ian Jones (ADNET Systems, Inc.)
-
Writers
- Jefferson Beck (USRA)
- Charles Webb (SGT)
- George R. Hale (Telophase)
Missions
This page is related to the following missions:Series
This page can be found in the following series:Related papers
Citation: Fretwell, P., Pritchard, H. D., Vaughan, D. G., Bamber, J. L., Barrand, N. E., Bell, R., Bianchi, C., Bingham, R. G., Blankenship, D. D., Casassa, G., Catania, G., Callens, D., Conway, H., Cook, A. J., Corr, H. F. J., Damaske, D., Damm, V., Ferraccioli, F., Forsberg, R., Fujita, S., Gim, Y., Gogineni, P., Griggs, J. A., Hindmarsh, R. C. A., Holmlund, P., Holt, J. W., Jacobel, R. W., Jenkins, A., Jokat, W., Jordan, T., King, E. C., Kohler, J., Krabill, W., Riger-Kusk, M., Langley, K. A., Leitchenkov, G., Leuschen, C., Luyendyk, B. P., Matsuoka, K., Mouginot, J., Nitsche, F. O., Nogi, Y., Nost, O. A., Popov, S. V., Rignot, E., Rippin, D. M., Rivera, A., Roberts, J., Ross, N., Siegert, M. J., Smith, A. M., Steinhage, D., Studinger, M., Sun, B., Tinto, B. K., Welch, B. C., Wilson, D., Young, D. A., Xiangbin, C., and Zirizzotti, A.: Bedmap2: improved ice bed, surface and thickness datasets for Antarctica, The Cryosphere, 7, 375-393, doi:10.5194/tc-7-375-2013, 2013.
Citation: Fretwell, P., Pritchard, H. D., Vaughan, D. G., Bamber, J. L., Barrand, N. E., Bell, R., Bianchi, C., Bingham, R. G., Blankenship, D. D., Casassa, G., Catania, G., Callens, D., Conway, H., Cook, A. J., Corr, H. F. J., Damaske, D., Damm, V., Ferraccioli, F., Forsberg, R., Fujita, S., Gim, Y., Gogineni, P., Griggs, J. A., Hindmarsh, R. C. A., Holmlund, P., Holt, J. W., Jacobel, R. W., Jenkins, A., Jokat, W., Jordan, T., King, E. C., Kohler, J., Krabill, W., Riger-Kusk, M., Langley, K. A., Leitchenkov, G., Leuschen, C., Luyendyk, B. P., Matsuoka, K., Mouginot, J., Nitsche, F. O., Nogi, Y., Nost, O. A., Popov, S. V., Rignot, E., Rippin, D. M., Rivera, A., Roberts, J., Ross, N., Siegert, M. J., Smith, A. M., Steinhage, D., Studinger, M., Sun, B., Tinto, B. K., Welch, B. C., Wilson, D., Young, D. A., Xiangbin, C., and Zirizzotti, A.: Bedmap2: improved ice bed, surface and thickness datasets for Antarctica, The Cryosphere, 7, 375-393, doi:10.5194/tc-7-375-2013, 2013.
Datasets used
-
Daily L3 6.25 km 89 GHz Brightness Temperature (Tb) [Aqua: AMSR-E]
ID: 236 -
Sea Ice Concentration (Level 3 12.5 km Sea Ice Concentration) [Aqua: AMSR-E]
ID: 608 -
Operation Ice Bridge Flight Paths
ID: 657NASA DC-8 Flight Path
See all pages that use this dataset -
Bedmap (Antarctic Bedmap Topography)
ID: 785 -
Bedmap2 (Antarctic Bedmap2 Topography)
ID: 786 -
Antarctic Ice Sheet Velocity
ID: 787 -
Antarctic Bedmap2 Ice Thickness
ID: 788 -
Antarctic Bedmap2 Ice Surface Elevation
ID: 789
Note: While we identify the data sets used on this page, we do not store any further details, nor the data sets themselves on our site.
Related
- ID: 11274
 Produced Video
Release date
This page was originally published on Tuesday, June 4, 2013.
This page was last updated on Sunday, January 5, 2025 at 10:20 PM EST.