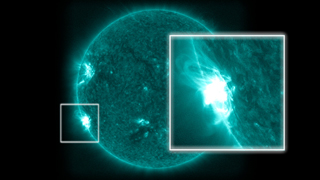
'X' Marks the Spot: SDO Observes a Reconnection Event
This is the source data material for the main release of X Marks the Spot: SDO Sees Reconnection.
Frames were generated using the standard SDO AIA 131 Å color table and an enhanced version to reveal the finer details of the coronal loops, which are overly saturated in the standard color table ranges.
A standard HD movie of the SDO/AIA 131 Å dataset.
This set of 4Kx4K frames was generated using an enhanced AIA 131Å color table.
This set of 4Kx4K frames was generated using the standard AIA 131 Å color table.
Credits
Please give credit for this item to:
NASA's Goddard Space Flight Center Scientific Visualization Studio, the SDO Science Team, and the Virtual Solar Observatory.
-
Animator
- Tom Bridgman (Global Science and Technology, Inc.)
-
Producer
- Genna Duberstein (USRA)
-
Scientist
- Gordon D. Holman (NASA/GSFC)
Missions
This page is related to the following missions:Related papers
Datasets used
-
AIA 131 (131 Filter) [SDO: AIA]
ID: 730This dataset can be found at: http://jsoc.stanford.edu/
See all pages that use this dataset
Note: While we identify the data sets used on this page, we do not store any further details, nor the data sets themselves on our site.
Release date
This page was originally published on Monday, July 15, 2013.
This page was last updated on Wednesday, May 3, 2023 at 1:52 PM EDT.
