Aquarius Sea Surface Salinity Tour 2012
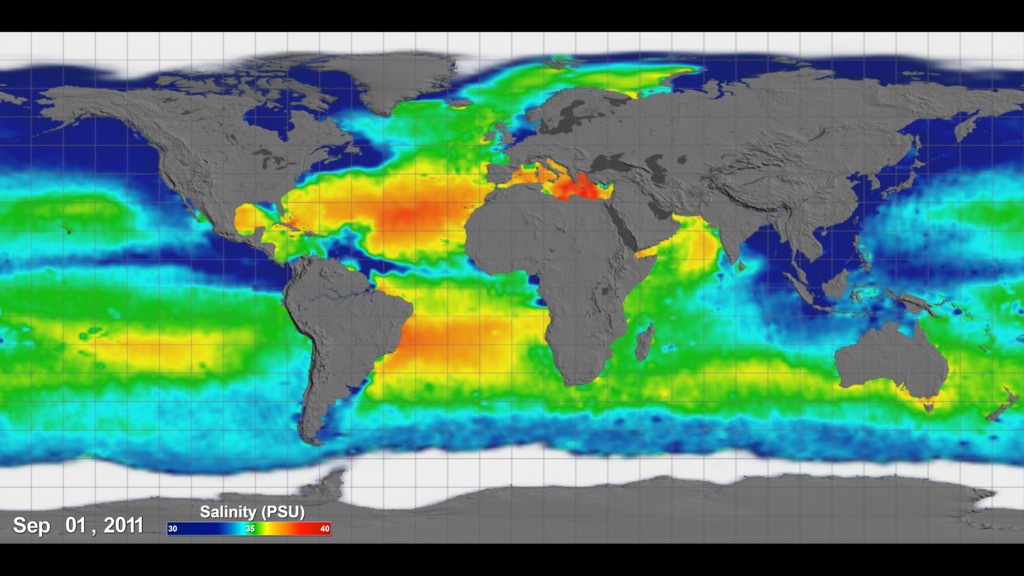
The Aquarius spacecraft is designed to measure global sea surface salinity. It is important to understand salinity, the amount of dissolved salts in water, because it will lead us to better understanding of the water cycle and can lead to improved climate models. Aquarius is a collaboration between NASA and the Space Agency of Argentina
This visualization celebrates over a year of successful Aquarius observations. Sea surface salinity is shown at various locations around the globe highlighting the following:
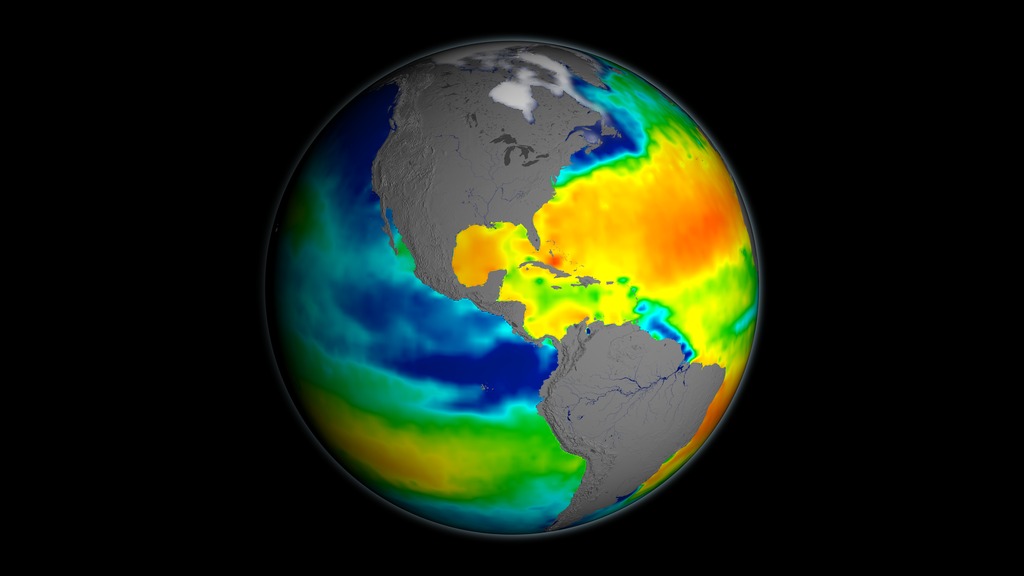
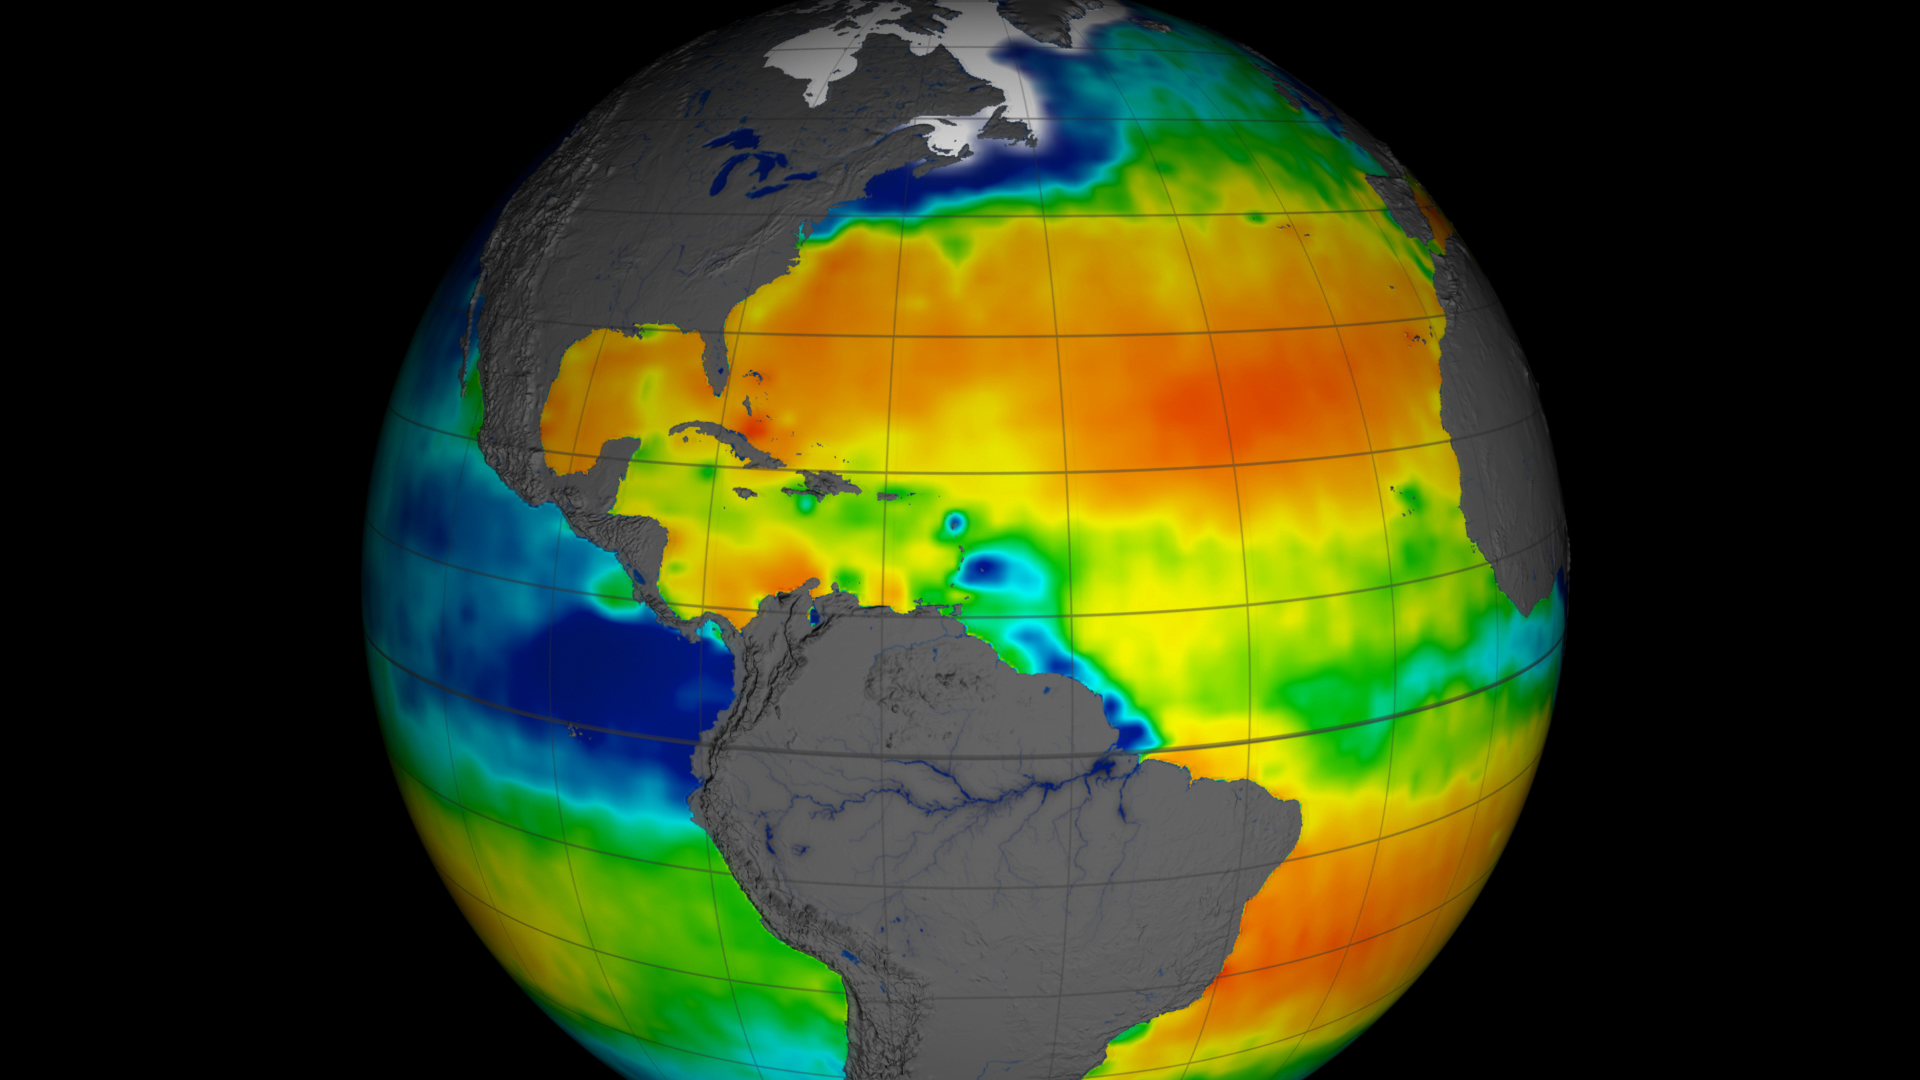
- the Atlantic Ocean is generally much more salty than the Pacific
- low salinity waters in the Eastern Equatorial Pacific are transported westward
- high influxes of fresh water from the Amazon River basin can be clearly seen
- low salinity waters are transported by the Labrador current to the south
- high influxes of fresh water from the Ganges River basin can be seen keeping the Eastern Indian Ocean lower salinity than the Western Indian Ocean
The range of time shown is December 2011 through Decemeber 2012. The data continuously loops through this range every 6 seconds. This visualization was generated based on version 2.0 of the Aquarius data products with all 3 scanning beams.
A narrated tour of Aquarius sea surface salinity data highlighting interesting features including: the North Atlantic, Eastern Pacific, Amazon outflow, Labrador current, and Indian Ocean.
For complete transcript, click here.
This video is also available on our YouTube channel.
A Spanish language narrated tour of Aquarius sea surface salinity data highlighting interesting features including: the North Atlantic, Eastern Pacific, Amazon outflow, Labrador current, and Indian Ocean.
For complete transcript, click here.
A tour of Aquarius sea surface salinity data highlighting interesting features including: the North Atlantic, Eastern Pacific, Amazon outflow, Labrador current, and Indian Ocean.

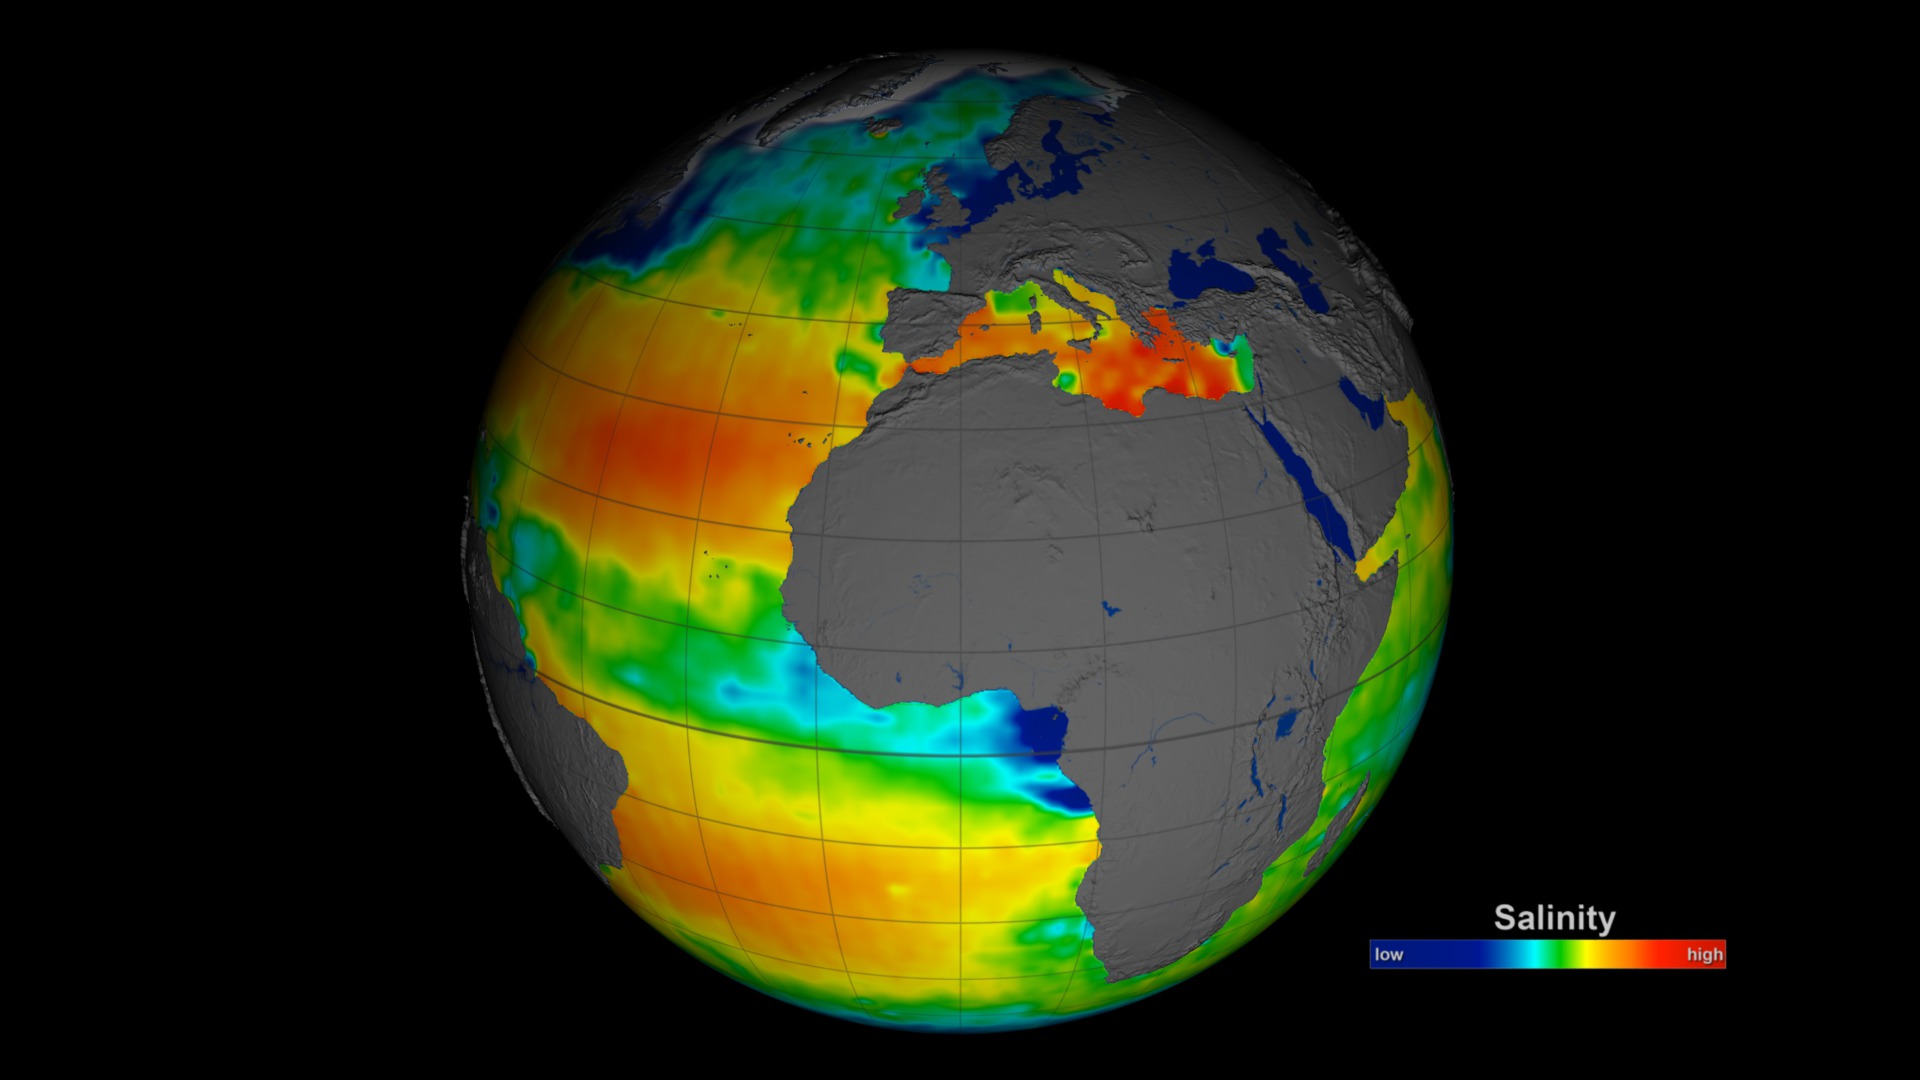
Print resolution still showing the salty North Atlantic.
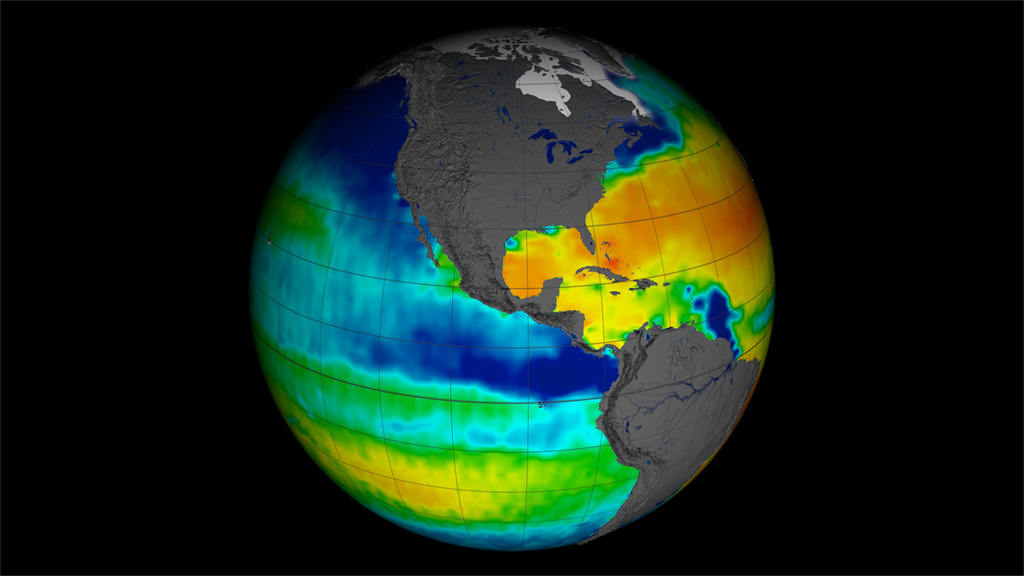
Print resolution still showing the low salinity region in the Eastern Tropical Pacific.
Print resolution still showing the massive outflow of fresh water from the Amazon River.
Print resolution still showing the low salinity melt water transported near Greenland and Labrador.
Print resolution still showing the higher salinity Western Indian Ocean compared to the low salinity Eastern Indian Ocean.
Print resolution still showing the Atlantic Ocean.
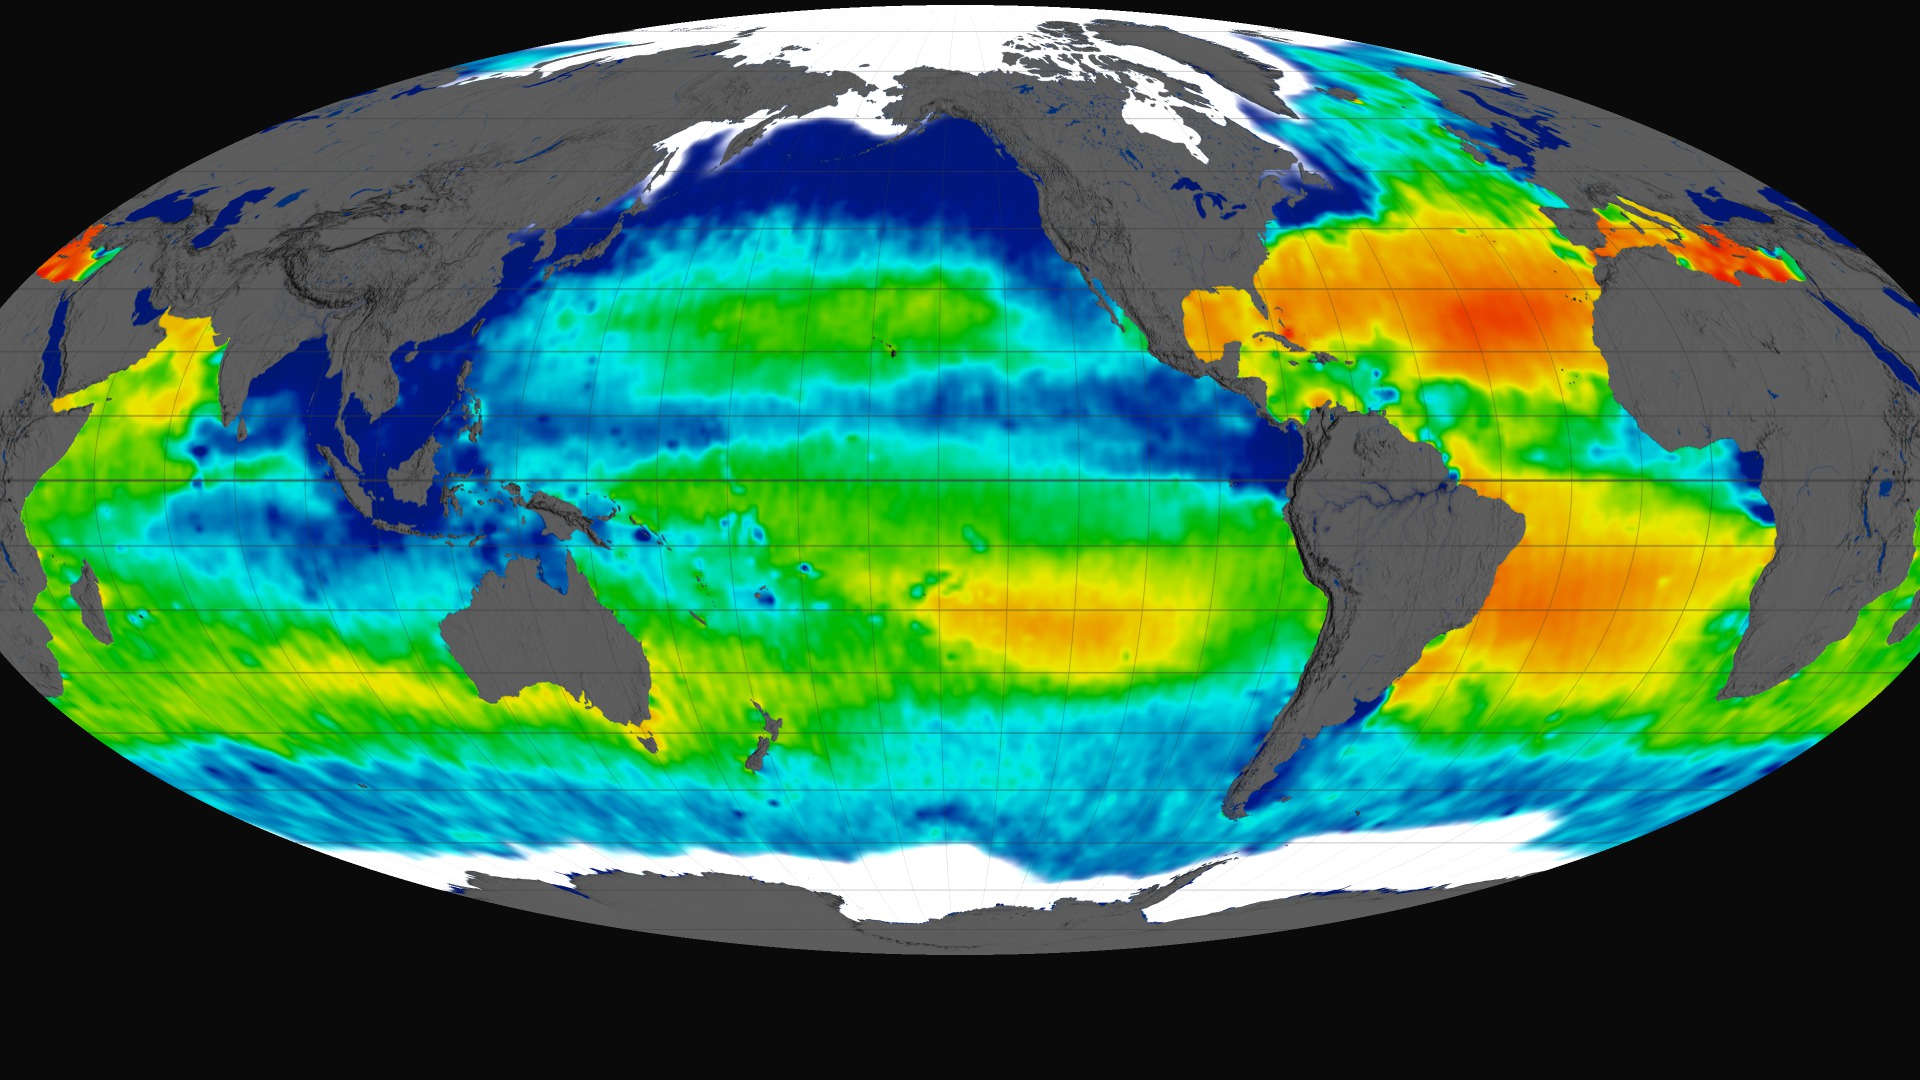
Print resolution still showing the Pacific Ocean.

Aquarius color bar intended for the public. The salinity range is low to high, going from blue to green to red.

Aquarius color bar intended for scientists. The salinity range is 30 to 40 PSU, going from blue to green to red.
For More Information
Credits
Please give credit for this item to:
NASA's Goddard Space Flight Center Scientific Visualization Studio
-
Animators
-
Greg Shirah
(NASA/GSFC)

- Horace Mitchell (NASA/GSFC)
-
Greg Shirah
(NASA/GSFC)
-
Narrators
- Chris Meaney (HTSI)
- Maria-Jose Vinas Garcia (Telophase)
-
Producer
- Kayvon Sharghi (USRA)
-
Scientists
- Gary Lagerloef (ESR)
- Gene Feldman (NASA/GSFC)
- Norman Kuring (NASA/GSFC)
Missions
This page is related to the following missions:Series
This page can be found in the following series:Datasets used
-
SSS (Sea Surface Salinity) [Aquarius: Microwave Radiometer]
ID: 774
Note: While we identify the data sets used on this page, we do not store any further details, nor the data sets themselves on our site.
Related
- ID: 5017
 Visualization
 - ID: 4233
 Visualization
 - ID: 4234
- ID: 11504
- ID: 11193
 Produced Video
 - ID: 4050
 Visualization
 - ID: 4046
 Visualization
Release date
This page was originally published on Wednesday, February 27, 2013.
This page was last updated on Sunday, February 2, 2025 at 10:10 PM EST.