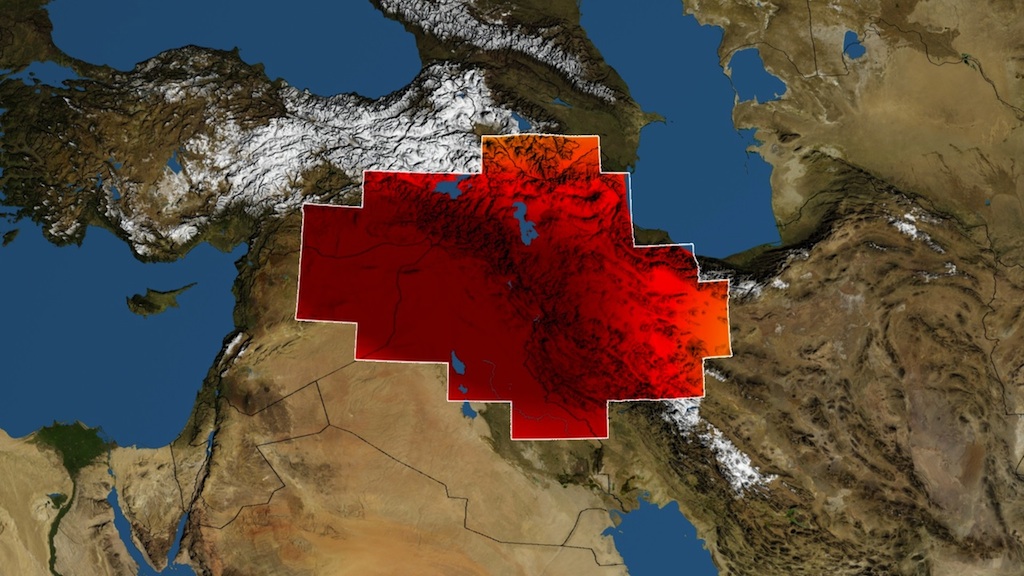
Freshwater Losses In The Middle East
The visualization shows variations in total water storage from normal, in millimeters, in the Tigris and Euphrates river basins, as measured by NASA's Gravity Recovery and Climate Experiment (GRACE) satellites, from January 2003 through December 2009. Reds represent drier conditions, while blues represent wetter conditions. The effects of the seasons are evident, as is the major drought that hit the region in 2007. The majority of the water lost was due to reductions in groundwater caused by human activities. By periodically measuring gravity regionally, GRACE tells scientists how much water storage changes over time.
GRACE Groundwater Depletion
GRACE Groundwater Depletion — No Dates or Colorbar
Dates

Colorbar
Credits
Please give credit for this item to:
NASA's Goddard Space Flight Center Scientific Visualization Studio
-
Animator
- Trent L. Schindler (USRA)
-
Producer
- Kayvon Sharghi (USRA)
-
Scientists
- Katalyn Voss (University of California, Irvine)
- Jay Famiglietti (University of California, Irvine)
-
Matthew Rodell
(NASA/GSFC)

Missions
This page is related to the following missions:Datasets used
-
[Gravity Recovery and Climate Experiment (GRACE)]
ID: 221
Note: While we identify the data sets used on this page, we do not store any further details, nor the data sets themselves on our site.
Related
- ID: 11189
 Produced Video
Release date
This page was originally published on Tuesday, February 12, 2013.
This page was last updated on Wednesday, October 9, 2024 at 12:03 AM EDT.