July 2012: Coronal Rain
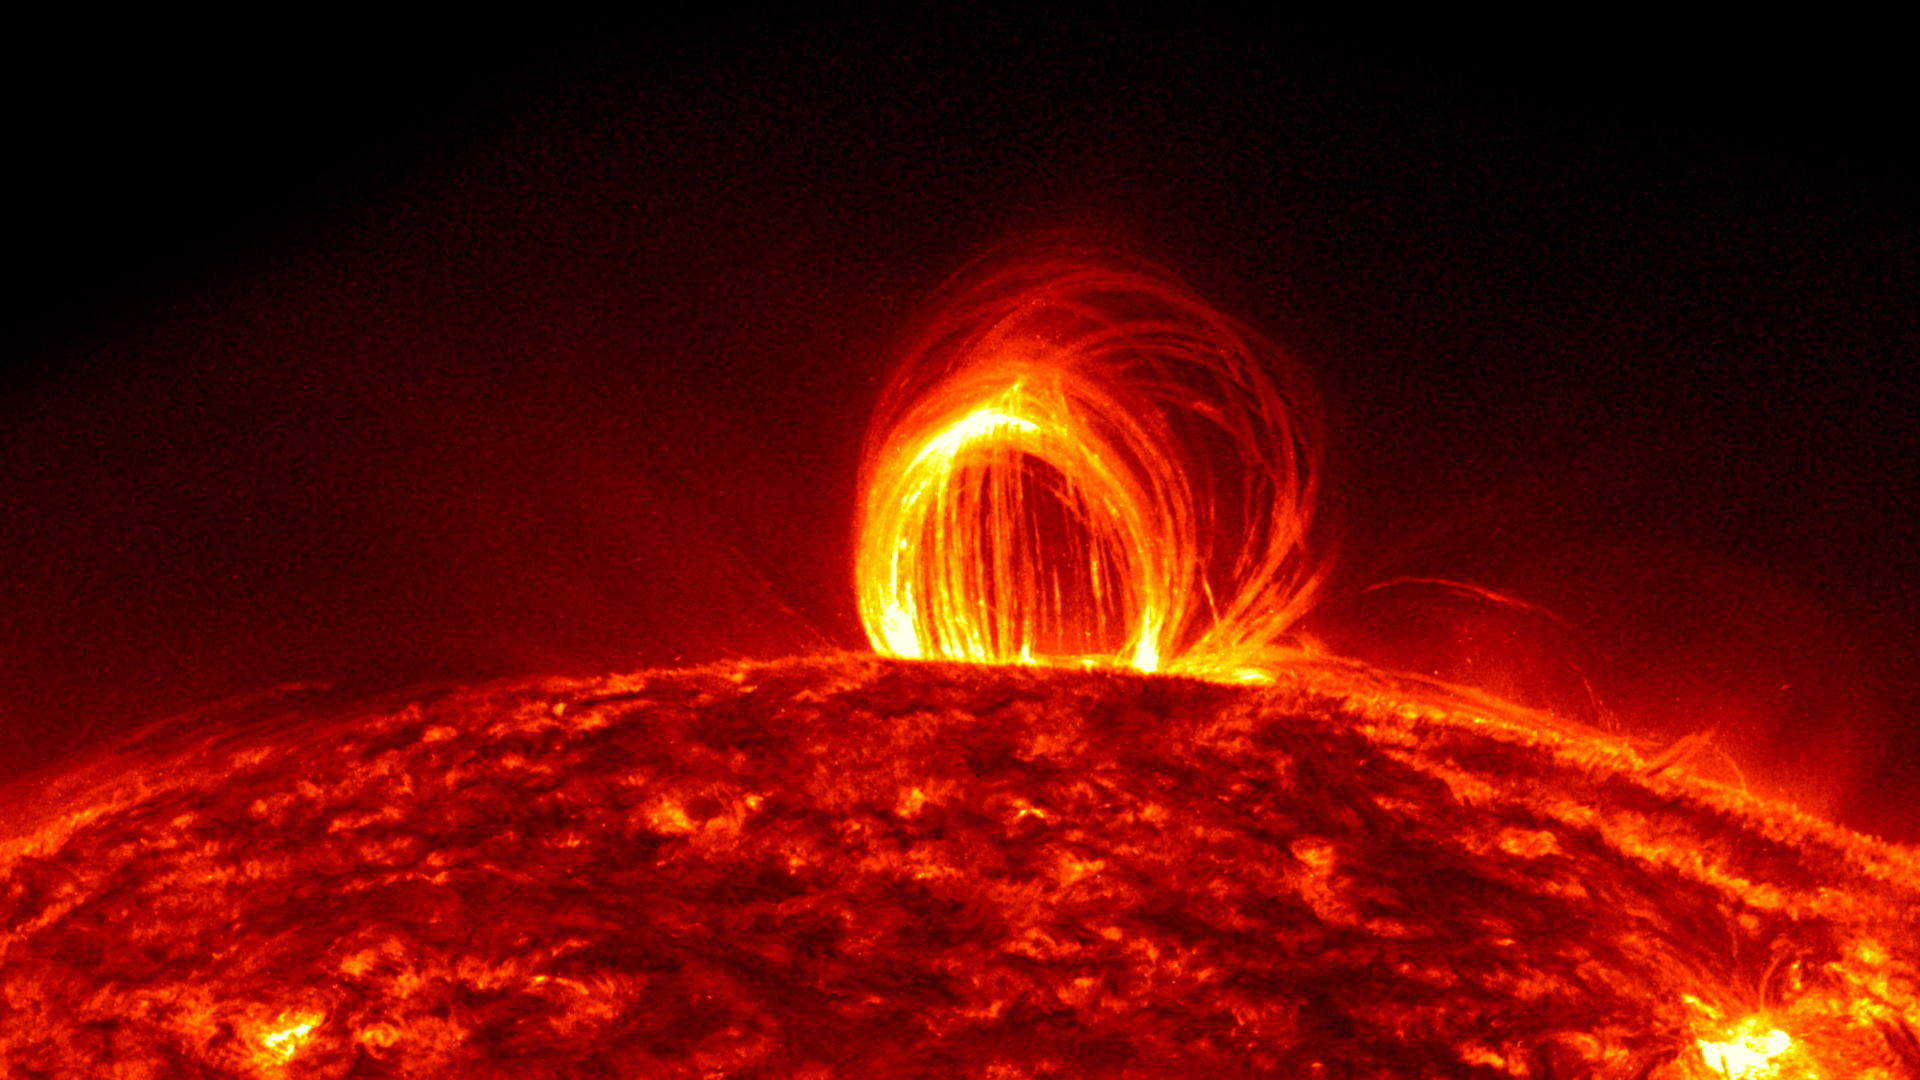
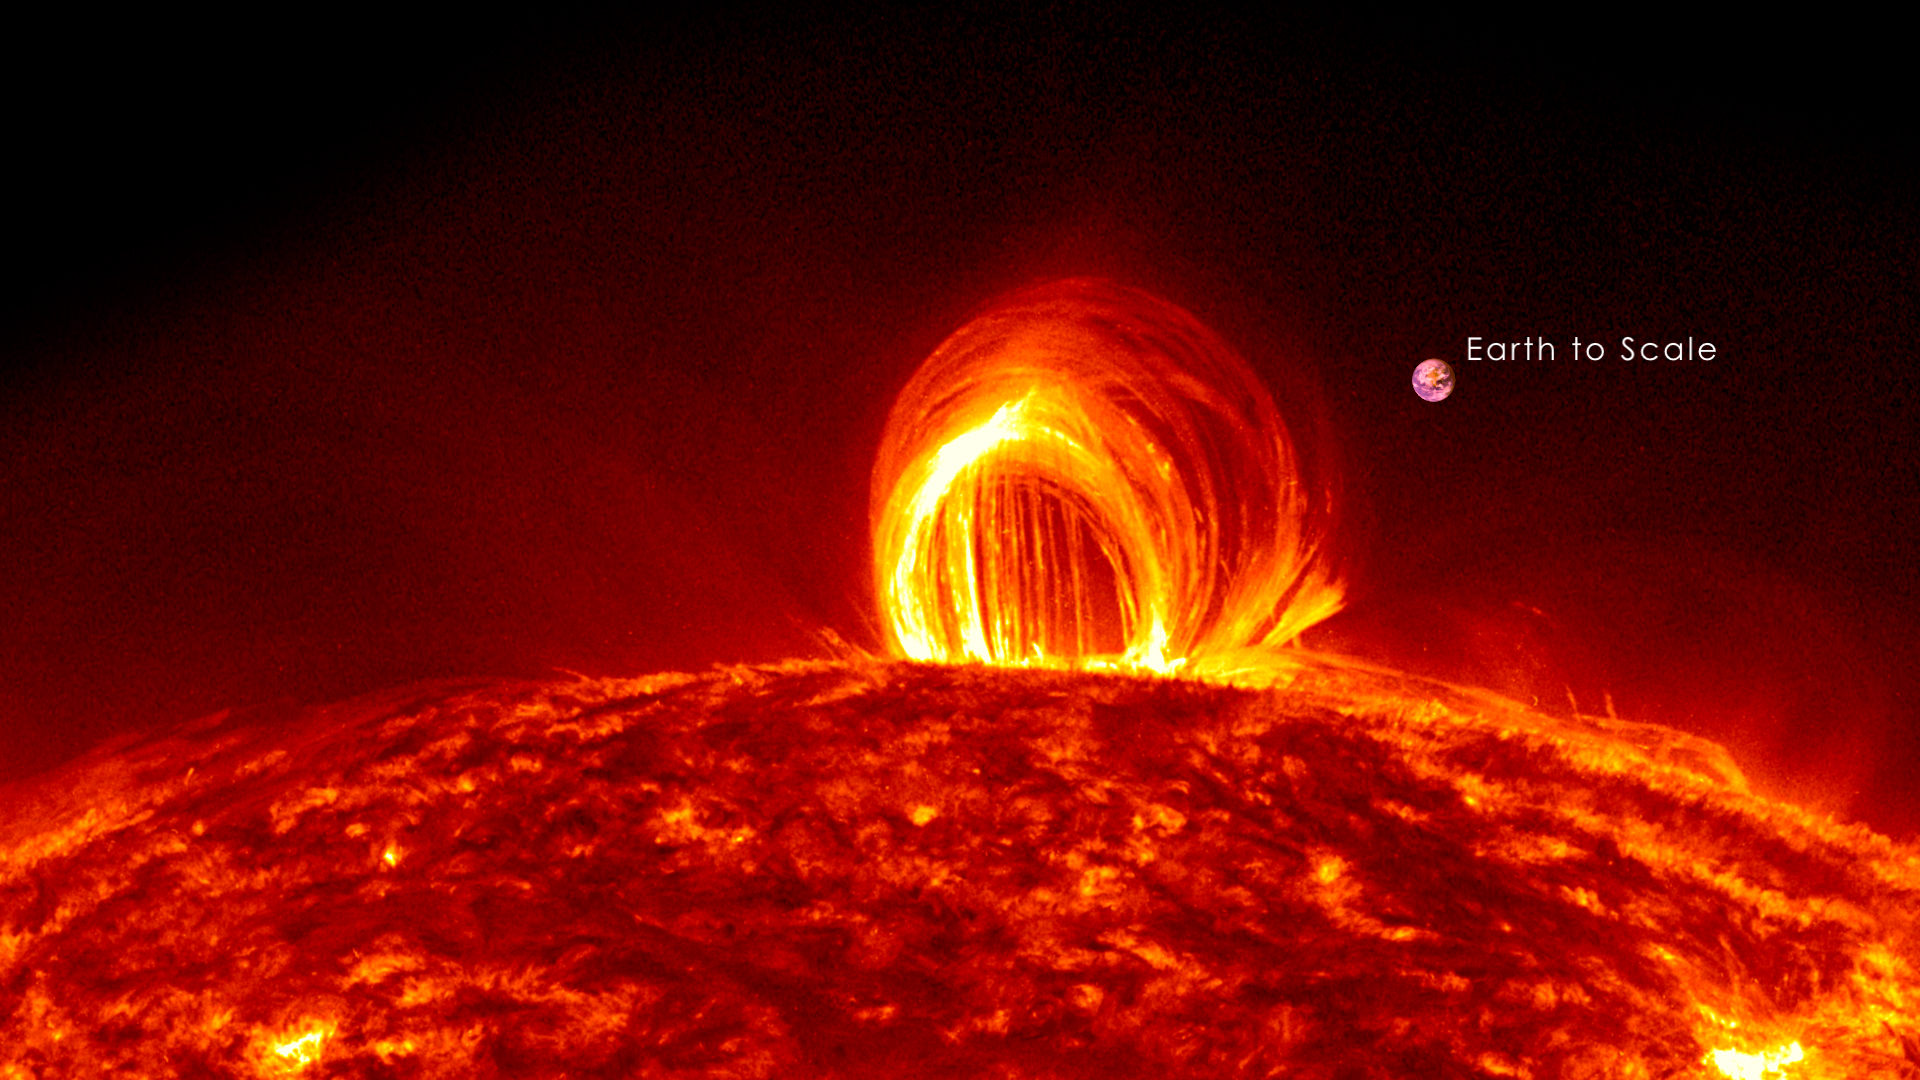
A moderate solar flare was emitted by the sun on July 19, 2012. At 5:58 UTC it peaked at M7.7 on the flare scale, which makes it fairly powerful, but still much weaker than X-class flares, which are the largest. What made this particular event so noteworthy was the associated activity in the sun's corona. For the next day, hot plasma in corona cooled and condensed along the strong magnetic fields of the region that produced the flare. Magnetic fields are invisible, but the plasma is very obvious in the extreme ultraviolet wavelength of 304 angstroms, which highlights material at a temperature of about 50,000 Kelvin. This plasma is attracted to the magnetic fields and outlines them very clearly as it slowly falls back to the solar surface. This process of condensing plasma falling to the surface is called coronal rain.
The footage in this video was collected by the Solar Dynamics Observatory's AIA instrument. SDO collected one frame every 12 seconds so each second in this video corresponds to 6 minutes of real time. The video covers 4:30 UTC on July 19th to 2:00 UTC on July 20th, a period of 21 hours and 30 minutes.
Music—"Thunderbolt" by Lars Leonhard
An HD1080 movie of the coronal rain (right limb of sun) in the 304 Å wavelength.
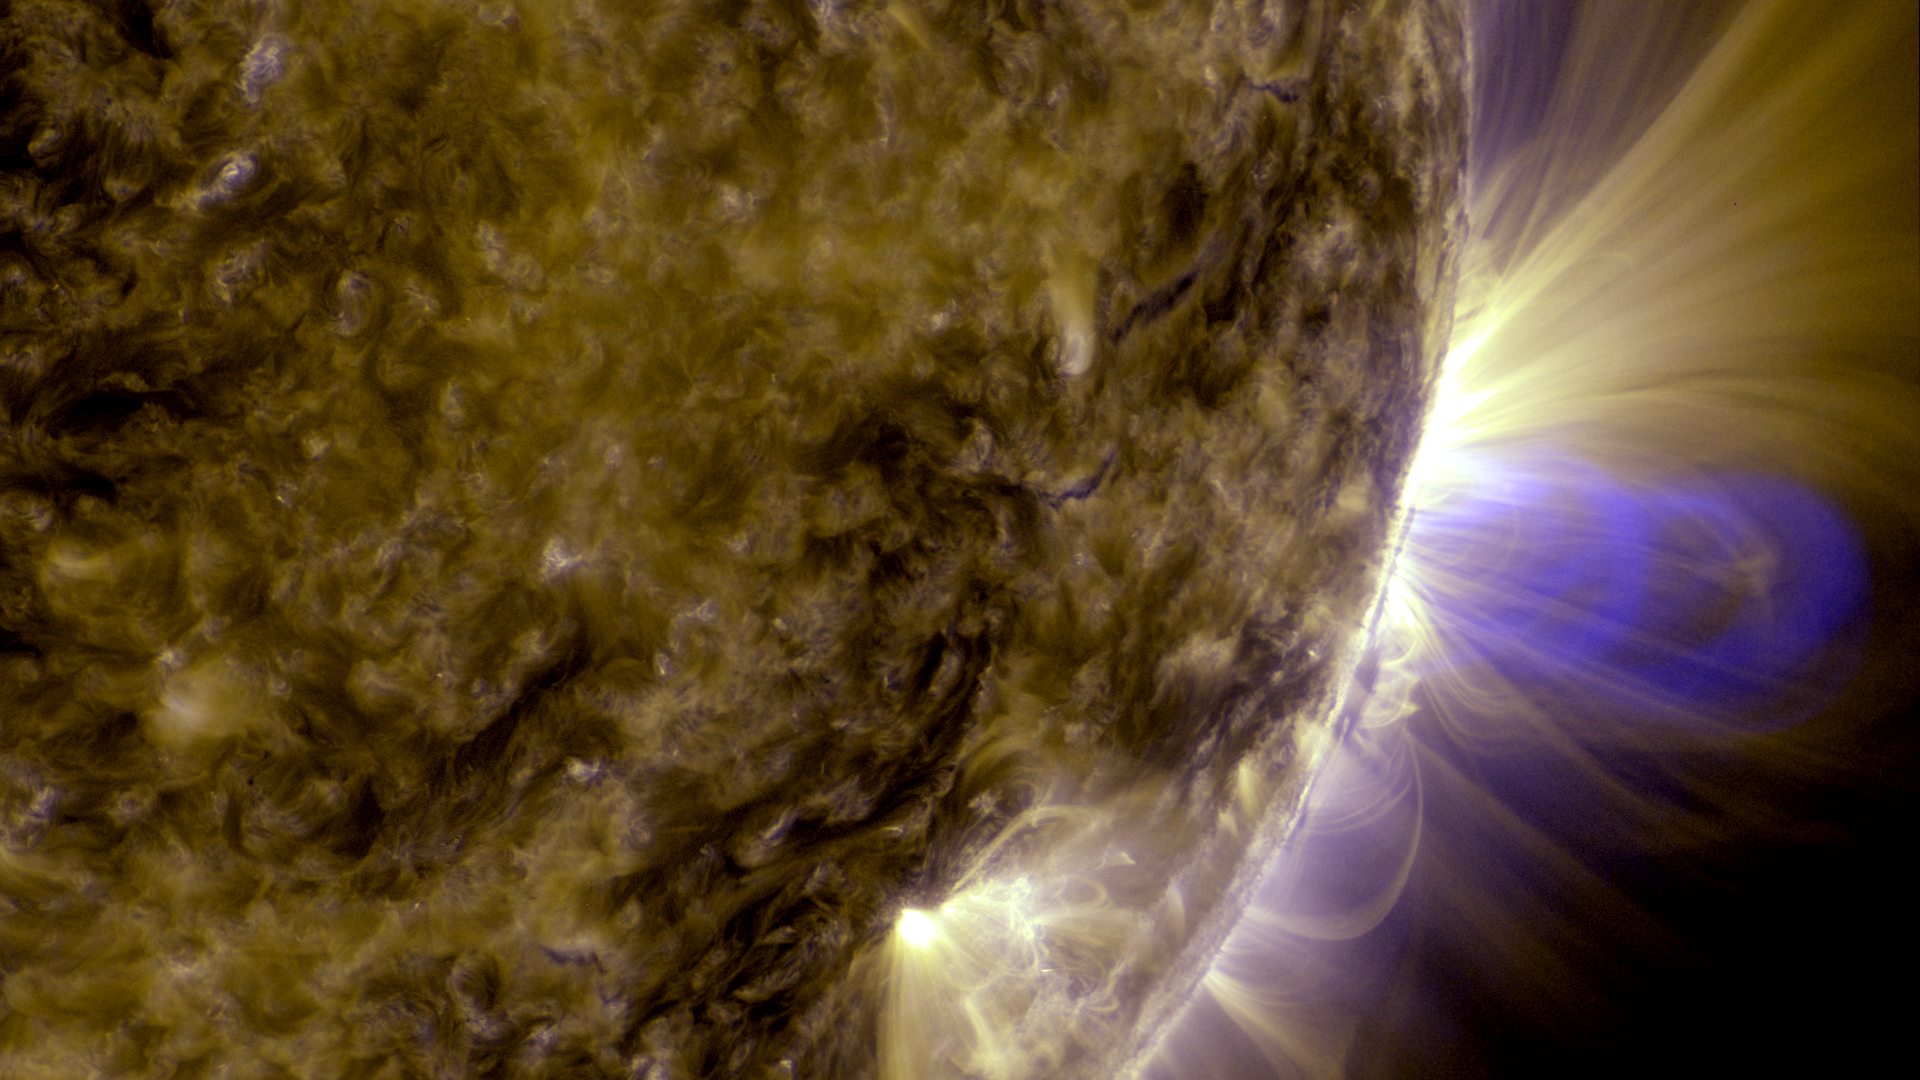
An HD1080 movie of the opening part of the coronal rain (right limb of sun) in the 171 Å wavelength.
A 4Kx4K frame set of the coronal rain (right limb of sun) in the 304 Å wavelength.
A 4Kx4K frame set of the opening part of the coronal rain (right limb of sun) in the 171 Å wavelength.
Credits
Please give credit for this item to:
NASA's Goddard Space Flight Center Scientific Visualization Studio, the SDO Science Team, and the Virtual Solar Observatory.
-
Animator
- Tom Bridgman (Global Science and Technology, Inc.)
-
Producer
- Scott Wiessinger (USRA)
-
Writer
- Karen Fox (ADNET Systems, Inc.)
Missions
This page is related to the following missions:Series
This page can be found in the following series:Datasets used
-
AIA 304 (304 Filter) [SDO: AIA]
ID: 677This dataset can be found at: http://jsoc.stanford.edu/
See all pages that use this dataset -
AIA 171 (171 Filter) [SDO: AIA]
ID: 680This dataset can be found at: http://jsoc.stanford.edu/
See all pages that use this dataset
Note: While we identify the data sets used on this page, we do not store any further details, nor the data sets themselves on our site.
Related
- ID: 11198
 Produced Video
 - ID: 11168
 Produced Video
 - ID: 11203
 Produced Video
Release date
This page was originally published on Wednesday, February 20, 2013.
This page was last updated on Sunday, February 2, 2025 at 10:09 PM EST.