A newer version of this visualization is available.
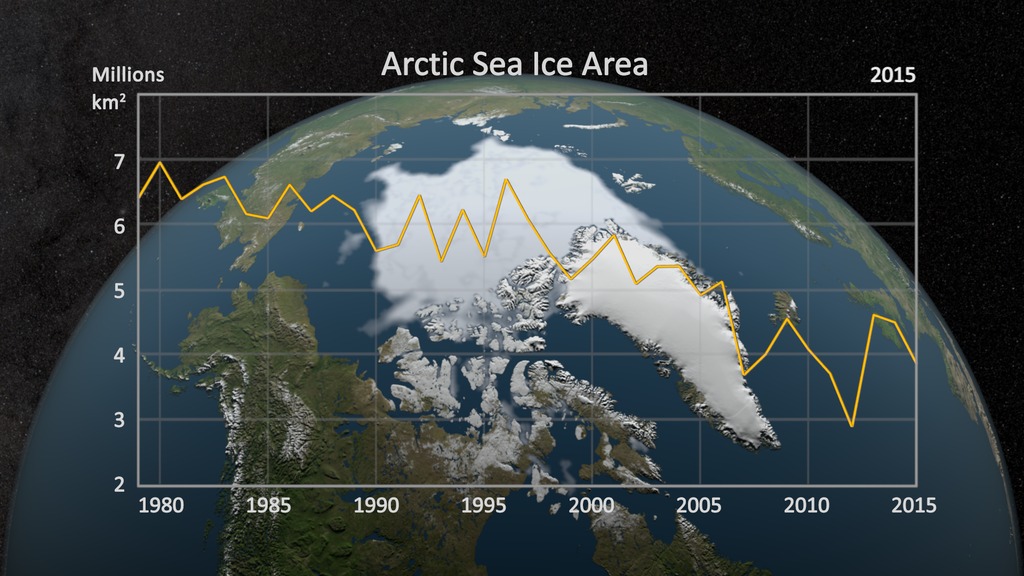
National Climate Assessment Annual Arctic Minimum Sea Ice Extents (1979-2012)
The National Climate Assessment (NCA) is a central component of the U.S. Global Change Research Program (USGCRP). Every four years, the NCA is required to produce a report for Congress that integrates, evaluates, and interprets the findings of the USGCRP; analyzes the effects of global change on the natural environment, agriculture, energy production and use, land and water resources, transportation, human health and welfare, human social systems, and biological diversity; and analyzes current trends in global change, both human-induced and natural, and projects major trends for the subsequent 25 to 100 years. A draft of the Third National Climate Assessment report is available on the Federal Advisory Committee website. The final report is slated to be released in 2014.
This scientific visualization of annual minimum sea ice area over the Arctic from 1979-2012 is one element of the NCA that highlights findings conveyed in the "Our Changing Climate", the "Alaska and the Arctic" and the "Impacts of Climate Change on Tribal, Indigenous, and Native Lands and Resources" chapters of the draft Third NCA report. This record shows a persistent decline in the minimum extent of Arctic sea ice cover. The satellite observations are from passive microwave sensors and processed using the NASA Team algorithm developed by scientists at NASA Goddard Space Flight Center. The sensors that collected the data are the Scanning Multichannel Microwave Radiometer (SMMR) on the NASA Nimbus-7 satellite and a series of Special Sensor Microwave Imagers (SSM/I) and Special Sensor Microwave Imager and Sounders (SSMIS) on U.S. Department of Defense Meteorological Satellite Program (DMSP) satellites. The data from the different sensors are carefully assembled to assure consistency throughout the 34 year record.
This visualization is similar to another developed by NASA, but is based on a slightly different algorithm to process the same sensor data. Both show similar downward trends in minimum sea ice area coverage over this time period.
Animation of Annual Minimum Sea Ice Extent over the Arctic from 1979 to 2012. (Final Composite.)
This video is also available on our YouTube channel.
Animated graph showing Annual Minimum Sea Ice Extent over the Arctic from 1979 to 2012. This animation sequence is used as an overlay synchronized with the background earth for the final composite.
Animation depicting Arctic September minimum sea ice extents from 1979 to 2012 (without year annotations). This animation sequence is used as the background for the final composite with the graph overlay.
Animation depicting Arctic September minimum sea ice extents from 1979 to 2012. This animation has a small annotated year in the upperleft corner corresponding with the relevant minimum sea ice extent for that year.

Print resolution still of the 1979 September minimum sea ice extent in the Arctic.
Print resolution still of the 2012 September minimum sea ice extent in the Arctic.
Credits
Please give credit for this item to:
NASA/Goddard Space Flight Center Scientific Visualization Studio
NSIDC
NOAA
-
Animators
-
Alex Kekesi
(Global Science and Technology, Inc.)

-
Greg Shirah
(NASA/GSFC)
-
Alex Kekesi
(Global Science and Technology, Inc.)
-
Visualizer
-
Cindy Starr
(Global Science and Technology, Inc.)
-
Cindy Starr
(Global Science and Technology, Inc.)
-
Video editor
-
Alex Kekesi
(Global Science and Technology, Inc.)
-
Alex Kekesi
(Global Science and Technology, Inc.)
-
Producer
- Allison Leidner (USRA)
-
Scientists
- Walt Meier (NSIDC)
- Mark C. Serreze (NSIDC)
- Ted Scambos (NSIDC)
- Julienne Stroeve (NSIDC)
- Don Cavalieri (NASA)
- Claire Parkinson (NASA/GSFC)
-
Project support
- Brooke Stewart (NOAA/NCDC,CICS-NC)
- Matt Savoie (NSIDC)
Series
This page can be found in the following series:Datasets used
-
Sea Ice Concentrations from Nimbus-7 SMMR and DMSP SSM/I-SSMIS Passive Microwave Data
ID: 761This data set is generated from brightness temperature data derived from the following sensors: the Nimbus-7 Scanning Multichannel Microwave Radiometer (SMMR), the Defense Meteorological Satellite Program (DMSP) -F8, -F11 and -F13 Special Sensor Microwave/Imagers (SSM/Is), and the DMSP-F17 Special Sensor Microwave Imager/Sounder (SSMIS). The data are provided in the polar stereographic projection at a grid cell size of 25 x 25 km. This product is designed to provide a consistent time series of sea ice concentrations (the fraction, or percentage, of ocean area covered by sea ice) spanning the coverage of several passive microwave instruments. To aid in this goal, sea ice algorithm coefficients are changed to reduce differences in sea ice extent and area as estimated using the SMMR and SSM/I sensors. The data are generated using the NASA Team algorithm developed by the Oceans and Ice Branch, Laboratory for Hydrospheric Processes at NASA Goddard Space Flight Center (GSFC).
This dataset can be found at: http://nsidc.org/data/nsidc-0051.html
See all pages that use this dataset
Note: While we identify the data sets used on this page, we do not store any further details, nor the data sets themselves on our site.
Newer Versions
- ID: 4435
 Visualization
Release date
This page was originally published on Wednesday, February 20, 2013.
This page was last updated on Wednesday, October 9, 2024 at 12:03 AM EDT.