Global Precipitiation Measurement Core Satellite Instruments
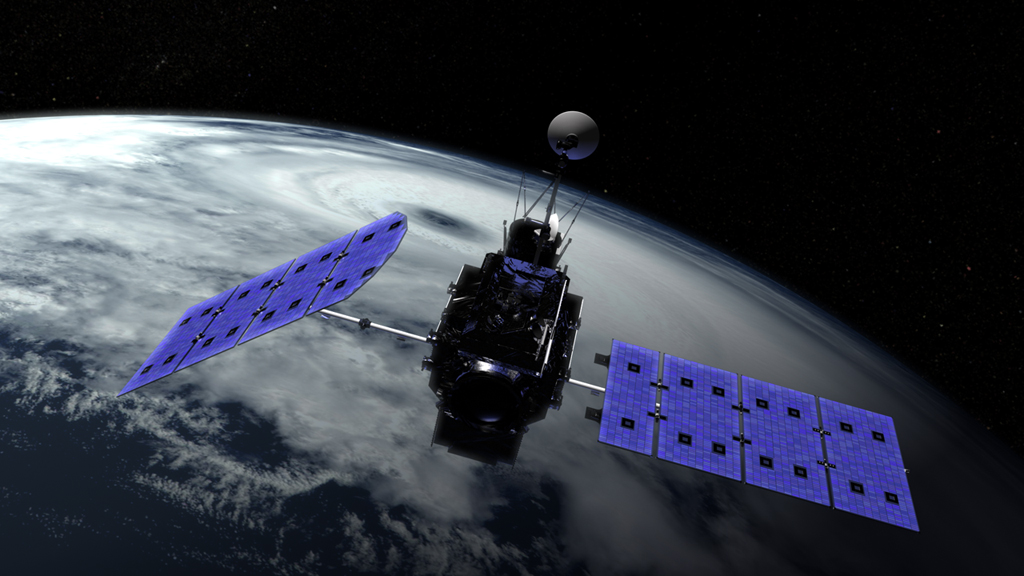
The Global Precipitation Measurement (GPM) mission is co-led by NASA and the Japan Aerospace Exploration Agency (JAXA). NASA and JAXA will provide a GPM Core satellite to serve as a reference for precipitation measurements made by a constellation of satellites. The GPM Core satellite carries two instruments: a state-of-the-art radiometer called the GPM Microwave Imager (GMI) and the first space-borne Dual-frequency Precipitation Radar (DPR), which sees the 3D structure of falling rain and snow. The DPR and GMI work in concert to provide a unique database that will be used to improve the accuracy and consistency of measurements from all partner satellites, which will then be combined into the uniform global precipitation dataset.
This animation shows the scanning capabilities of the GMI and DPR onboard the GPM Core satellite. Heavy rainfall is shown in red and light rainfall in blue. The DPR shows 3D precipitation in a midlatitude storm from two overlapping swaths. The Ka-band frequency scans across a region of 78 miles (125 kilometers) and is nested within the wider scan of the Ku-band frequency of 147 miles (245 kilometers). JAXA and Japan's National Institute of Information and Communications Technology (NICT) built the DPR. The GMI, shown as the flat precipitation values, constantly scans a region 550 miles (885 kilometers) across. The Ball Aerospace and Technology Corporation built the GMI under contract with NASA Goddard Space Flight Center.
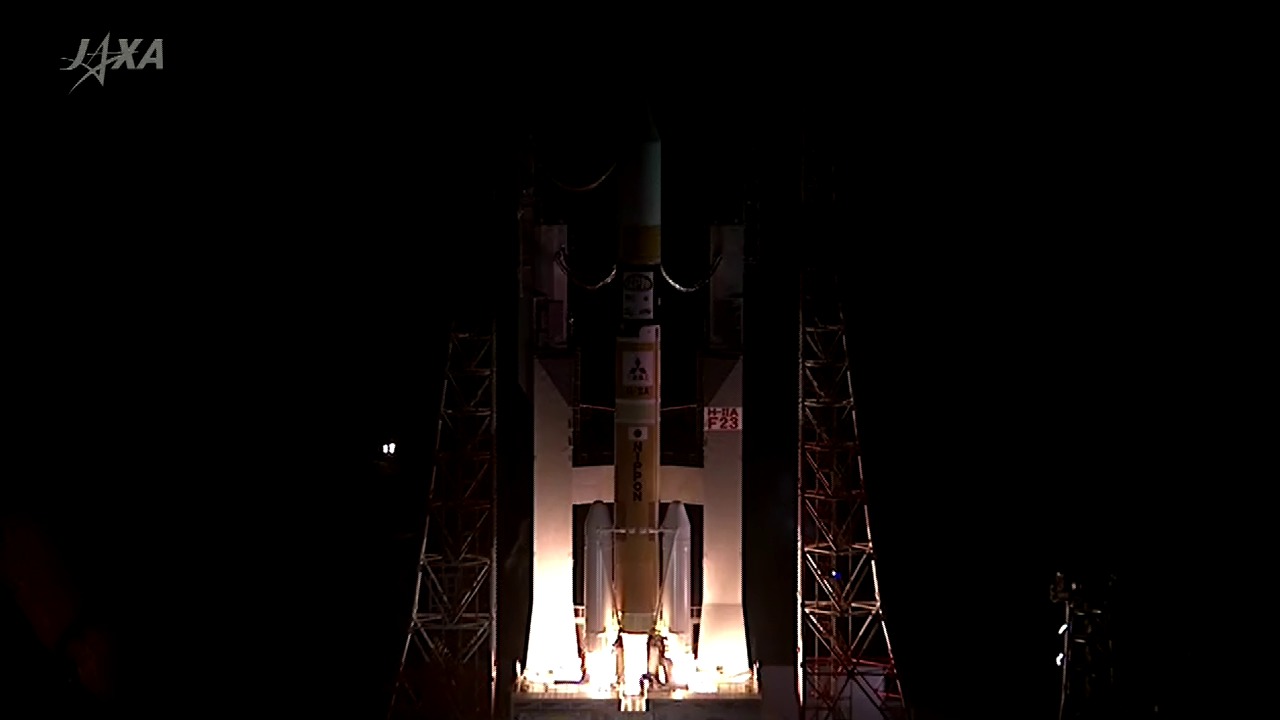
The GPM Core observatory is currently being built and tested at NASA's Goddard Space Flight Center in Greenbelt, Md. It is scheduled to launch from Tanegashima space center in Japan in early 2014.
GPM Instruments
This video is also available on our YouTube channel.
Credits
Please give credit for this item to:
NASA's Goddard Space Flight Center Scientific Visualization Studio
-
Animator
- Trent L. Schindler (USRA)
-
Producer
- Ryan Fitzgibbons (USRA)
-
Scientists
- Arthur Hou (NASA/GSFC)
- Dalia B Kirschbaum (NASA/GSFC)
- Gail Skofronick Jackson (NASA/GSFC)
Missions
This page is related to the following missions:Datasets used
-
GEOS Atmospheric Model
ID: 665
Note: While we identify the data sets used on this page, we do not store any further details, nor the data sets themselves on our site.
Release date
This page was originally published on Monday, December 3, 2012.
This page was last updated on Wednesday, May 3, 2023 at 1:52 PM EDT.

