African Fire Observations and MODIS NDVI
From space, we can understand fires in ways that are impossible from the ground. The MODIS instrument onboard the Terra and Aqua satellite, was specifically designed to detect fires. As a result, it can see both smaller fires and a wide range of fires from cool grass fires to raging forest fires. Burning carbon particles both on the tiny soot particles in the flame and on the fuel itself emit a very specific wavelength of light, 3.8 to 4 microns. NASA research has contributed to much improved detection of fire for scientific purposes using satellite remote sensing and geographic information systems. This has helped advance our understanding of the impacts of fire in many areas of earth science, including atmospheric chemistry and the impacts on protected areas. This research has led to the development of a rapid response system widely used throughout the world for both natural resource management and for firefighting by providing near real-time information.
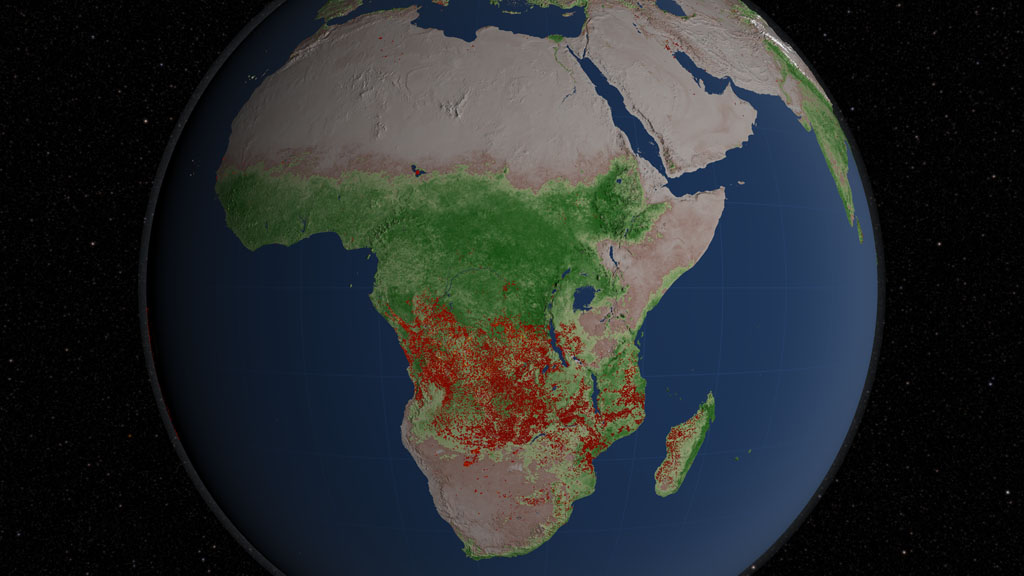
The visualization shows fires detected in Africa from July 2002 through July 2011. Africa has more abundant burning than any other continent. MODIS observations have shown that some 70 percent of the world's fires occur in Africa alone. "It's incredibly satisfying to see such a long record of fires visualized," said Chris Justice, a scientist from the University of Maryland who leads NASA's effort to use MODIS data to study the world's fires. "It's not only exciting visually, but what you see here is a very good representation of the data scientists use to understand the global distribution of fires and to determine where and how fires are responding to climate change and population growth."
More information on the Fire Information for Resource Management (FIRMS) is available at http://maps.geog.umd.edu/firms/.
Eleven years of MODIS Fires in Africa over 16 day composite MODIS NDVI and 16 day composite MODIS snow and ice.

This chart shows MODIS fires over MODIS NDVI every March 15, July 15, September 15, and December 15 between July 2002 and July 2011. MODIS detects the seasonality of fire.
Active fires and vegetation index for July 15, 2002.
Active fires and vegetation index for September 15, 2002.
Active fires and vegetation index for December 15, 2002.
Active fires and vegetation index for March 15, 2003.
Active fires and vegetation index for July 15, 2003.
Active fires and vegetation index for September 15, 2003.
Active fires and vegetation index for December 15, 2003.
Active fires and vegetation index for March 15, 2004.
Active fires and vegetation index for July 15, 2004.
Active fires and vegetation index for September 15, 2004.
Active fires and vegetation index for December 15, 2004.
Active fires and vegetation index for March 15, 2005.
Active fires and vegetation index for July 15, 2005.
Active fires and vegetation index for September 15, 2005.
Active fires and vegetation index for December 15, 2005.
Active fires and vegetation index for March 15, 2006.
Active fires and vegetation index for July 15, 2006.
Active fires and vegetation index for September 15, 2006.
Active fires and vegetation index for December 15, 2006.
Active fires and vegetation index for March 15, 2007.
Active fires and vegetation index for July 15, 2007.
Active fires and vegetation index for September 15, 2007.
Active fires and vegetation index for December 15, 2007.
Active fires and vegetation index for March 15, 2008.
Active fires and vegetation index for July 15, 2008.
Active fires and vegetation index for September 15, 2008.
Active fires and vegetation index for December 15, 2008.
Active fires and vegetation index for March 15, 2009.
Active fires and vegetation index for July 15, 2009.
Active fires and vegetation index for September 15, 2009.
Active fires and vegetation index for December 15, 2009.
Active fires and vegetation index for March 15, 2010.
Active fires and vegetation index for July 15, 2010.
Active fires and vegetation index for September 15, 2010.
Active fires and vegetation index for December 15, 2010.
Active fires and vegetation index for July 15, 2011.
Colortable showing MODIS fire pixels. The number colorized is MODIS MCD14ML T21 Brightness temperature minus the T31 Brightness temperature.

Colortable showing MODIS' 16 day composite NDVI product.
Credits
Please give credit for this item to:
NASA/Goddard Space Flight Center Scientific Visualization Studio
-
Animators
- Lori Perkins (NASA/GSFC)
-
Greg Shirah
(NASA/GSFC)

-
Producer
- Kayvon Sharghi (USRA)
-
Scientists
- Chris Justice (University of Maryland)
- Louis Giglio (SSAI)
- Luigi Boschetti (University of Maryland College Park)
-
Writer
- Adam P Voiland (Wyle Information Systems)
Missions
This page is related to the following missions:Series
This page can be found in the following series:Datasets used
-
Fire Location [Terra and Aqua: MODIS]
ID: 496Credit: Fire location data courtesy of MODIS Rapid Response Project (NASA/GSFC and University of Maryland - http://rapidfire.sci.gsfc.nasa.gov)
See all pages that use this dataset -
NDVI (Normalized Difference Vegetation Index (NDVI)) [Terra and Aqua: MODIS]
ID: 633
Note: While we identify the data sets used on this page, we do not store any further details, nor the data sets themselves on our site.
Related
- ID: 10832
 Produced Video
Release date
This page was originally published on Tuesday, October 18, 2011.
This page was last updated on Wednesday, May 3, 2023 at 1:53 PM EDT.