Space Weather Event: Close-up on the Earth Environment
We open with a view from high above the ecliptic plane, at the space between the Sun (left) and the Earth (within the small rectangular box on the right). In the plane of the Earth's orbit, we show a 'slice' of the Enlil model showing the particle density profile of the solar wind (white to yellow for decreasing particle density). The spiral 'rotating water sprinkler' pattern in the density is the Parker spiral (Wikipedia).
We zoom down to the Earth as the CME (orange surface) erupts in the direction of the Earth and move into a position above the Earth's orbital plane with the Earth (geospace) environment in view.
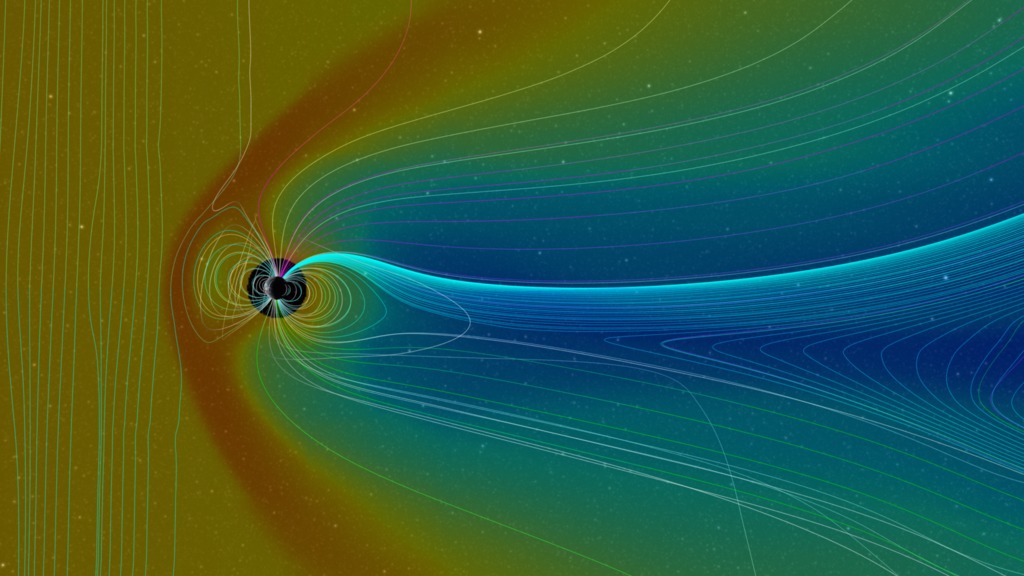
As the particle density enhancement from the CME strikes the Earth, we see the Earth's magnetosphere respond, with the outer, high density surface (red) 'blown away'. This surface location corresponds roughly to the location of the bow shock. The bow shock has not been eliminated, only some of its particles have been depleted, to be carried off in the CME and solar wind. As the densest material of the CME passes (orange surface), plasma from the CME continues to flow by the Earth, stretching the magnetosphere into a long, thin structure behind the Earth.
The magnetosphere slowly recovers from the 'impact', and regions that can confine higher particle densities reform - the red surfaces return. But not for long as the rarefaction (Wikipedia) behind the CME reaches the Earth. This lower density region provides fewer particles to repopulate the magnetosphere and makes it easier for particles confined in the magnetosphere to 'leak' out into the solar wind.
For the BATS-R-US model, the isosurface colors are: red=20 AMUs per cubic centimeter, yellow=10.0 AMUs per cubic centimeter, light blue=1.0 AMUs per cubic centimeter, and blue=0.1 AMUs per cubic centimeter. An AMU corresponds to about the mass of a hydrogen atom, the dominant component of the solar wind.
This visualization is part of a series of visualizations on space weather modeling.
This is the full movie of the CME striking the Earth.

A view high above the Earth's orbital plane, showing the Sun and the Earth. The Parker spiral pattern is visible in the density of the solar wind.
With this view, we look down on the Earth from above the Earth's orbital plane as the CME is about to strike the Earth. The density isosurfaces of the BATS-R-US model are visible in the computational box surrounding the Earth.
Much closer to the Earth, the particle density enhancement of the CME has begun striking the Earth's magnetosphere.
The CME has passed now, and the interaction has depleted much of the particles in the magnetosphere. The magnetospheric bow shock is no longer visible at the magnetospheric densities displayed.
Credits
Please give credit for this item to:
NASA's Scientific Visualization Studio, the Space Weather Research Center (SWRC), the Community-Coordinated Modeling Center (CCMC) and the Space Weather Modeling Framework (SWMF), Enlil and Dusan Odstrcil (GMU).
-
Animators
- Tom Bridgman (Global Science and Technology, Inc.)
-
Greg Shirah
(NASA/GSFC)

-
Producer
- Scott Wiessinger (UMBC)
-
Scientist
- Michael Hesse (NASA/GSFC)
Series
This page can be found in the following series:Datasets used
-
SSCweb ephemerides (SSCweb)
ID: 538Satellite ephemerides
This dataset can be found at: http://sscweb.gsfc.nasa.gov
See all pages that use this dataset -
JPL/Horizon Orbital Ephemerides
ID: 597Planetary ephemerides
This dataset can be found at: http://ssd.jpl.nasa.gov/?horizons
See all pages that use this dataset -
Enlil Heliospheric Model (Enlil Heliospheric Model)
ID: 685MHD solar wind simulation
See all pages that use this dataset -
BATS-R-US Magnetosphere Model
ID: 686MHD Magnetospheric simulation
See all pages that use this dataset
Note: While we identify the data sets used on this page, we do not store any further details, nor the data sets themselves on our site.
Related
- ID: 4188
Release date
This page was originally published on Thursday, July 8, 2010.
This page was last updated on Wednesday, May 3, 2023 at 1:54 PM EDT.