Space Weather Event: A View from the Orbit Plane
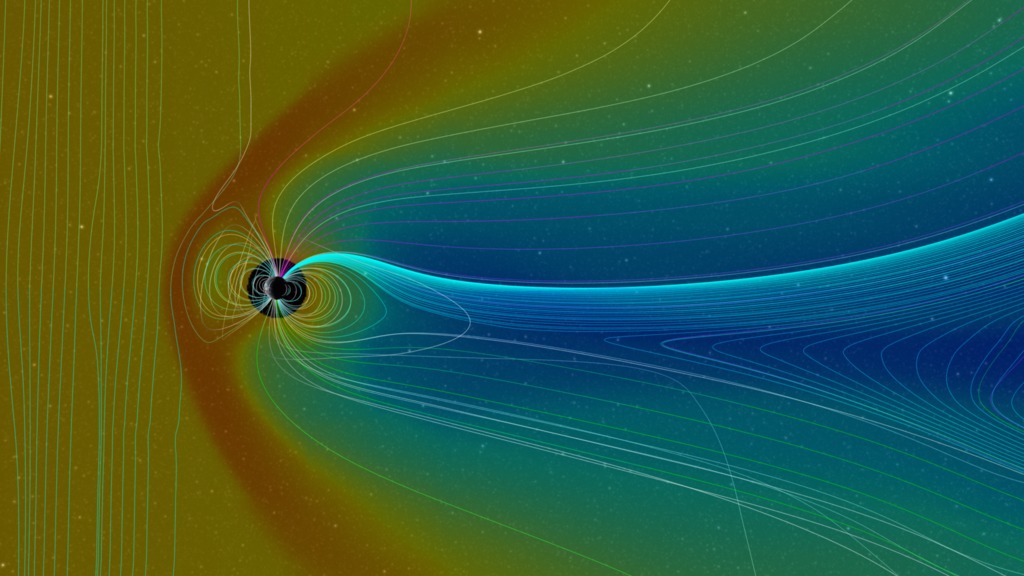
We start with a view of the space between the Sun (left) and the Earth (within the small rectangular box on the right), slightly above the ecliptic plane. In the plane of the Earth's orbit, we show a 'slice' of the particle density profile of the solar wind (white to yellow for decreasing particle density). Perpendicular to this, we have another 'slice' of particle density from the Enlil model. The Enlil model extends to 60 degrees above and below the solar equator, and beyond 20 solar radii from the Sun. This gap creates the 'hourglass' empty region around the Sun.
The CME (orange surface) erupts in the direction of the Earth. The orange surface represents a boundary of common pressure differences, which better identifies sharp transitions in pressure common in shocks fronts. The CME clears out particles in the region behind it, called a rarefaction (Wikipedia), visible in the particle density.
This visualization is part of a series of visualizations on space weather modeling.
This is the full movie of the CME striking the Earth.

The CME has not yet been ejected.
The CME has passed the Earth.
Credits
Please give credit for this item to:
NASA's Scientific Visualization Studio, the Space Weather Research Center (SWRC), the Community-Coordinated Modeling Center (CCMC) and the Space Weather Modeling Framework (SWMF), Enlil and Dusan Odstrcil (GMU).
-
Animators
- Tom Bridgman (Global Science and Technology, Inc.)
-
Greg Shirah
(NASA/GSFC)

-
Producer
- Scott Wiessinger (UMBC)
-
Scientist
- Michael Hesse (NASA/GSFC)
Series
This page can be found in the following series:Datasets used
-
Enlil Heliospheric Model (Enlil Heliospheric Model)
ID: 685MHD solar wind simulation
See all pages that use this dataset
Note: While we identify the data sets used on this page, we do not store any further details, nor the data sets themselves on our site.
Related
- ID: 4188
Release date
This page was originally published on Thursday, July 8, 2010.
This page was last updated on Wednesday, May 3, 2023 at 1:54 PM EDT.