A newer version of this visualization is available.
AMSR-E Arctic Sea Ice: September 2009 to March 2010
Sea ice is frozen seawater floating on the surface of the ocean. Some sea ice is semi-permanent, persisting from year to year, and some is seasonal, melting and refreezing from season to season. The sea ice cover reaches its minimum extent at the end of each summer and the remaining ice is called the perennial ice cover.
In this animation, the Arctic sea ice and seasonal land cover change progress through time, from September 1, 2009 when sea ice in the Arctic was near its minimum extent, through March 30, 2010. The animation plays at a rate of six frames per day or ten days per second. Over the water, Arctic sea ice changes from day to day showing a running 3-day maximum sea ice concentration in the region where the concentration is greater than 15%. The blueish white color of the sea ice is derived from a 3-day running maximum of the AMSR-E 89 GHz brightness temperature. Over the terrain, monthly data from the seasonal Blue Marble Next Generation fades slowly from month to month.
The composite animation showing the sea ice over a star field background with dates.
The sea ice animation without the dates or star background with transparency.
The star background with transparency.
The date sequence with transparency.

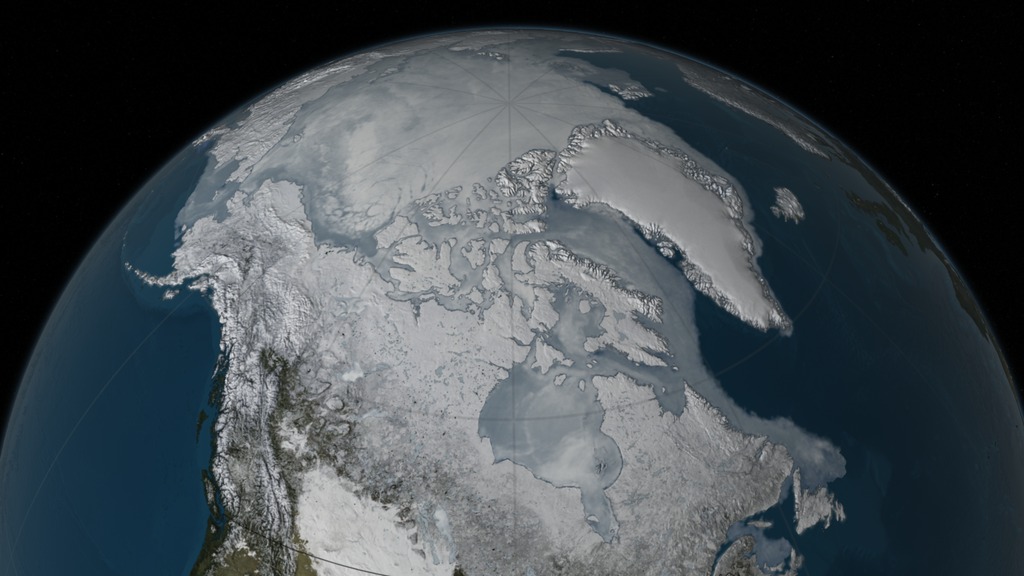
A print resolution image of the Arctic sea ice with a star background on March 6, 2010.
A print resolution image of the Arctic sea ice with a star background on March 31, 2010.
Credits
Please give credit for this item to:
NASA/Goddard Space Flight Center Scientific Visualization Studio. The Blue Marble data is courtesy of Reto Stockli (NASA/GSFC).
-
Visualizer
-
Cindy Starr
(Global Science and Technology, Inc.)

-
Cindy Starr
(Global Science and Technology, Inc.)
-
Animators
- Helen-Nicole Kostis (UMBC)
- Trent L. Schindler (UMBC)
-
Video editors
- Laura Motel (UMBC)
- Rich Melnick (HTSI)
-
Producer
- Michelle Williams (UMBC)
-
Scientist
- Josefino Comiso (NASA/GSFC)
-
Project support
- James W. Williams (Global Science and Technology, Inc.)
- Shiloh Heurich (Global Science and Technology, Inc.)
-
Writer
- Kathryn Hansen (Wyle Information Systems)
Missions
This page is related to the following missions:Datasets used
-
Daily L3 6.25 km 89 GHz Brightness Temperature (Tb) [Aqua: AMSR-E]
ID: 236 -
Sea Ice Concentration (Daily L3 12.5km Tb, Sea Ice Concentration, and Snow Depth) [Aqua: AMSR-E]
ID: 237 -
Blue Marble Land Cover [Terra and Aqua: MODIS]
ID: 510Credit: The Blue Marble data is courtesy of Reto Stockli (NASA/GSFC).
See all pages that use this dataset
Note: While we identify the data sets used on this page, we do not store any further details, nor the data sets themselves on our site.
Newer Versions
- ID: 4440
 Visualization
Release date
This page was originally published on Monday, March 29, 2010.
This page was last updated on Wednesday, May 3, 2023 at 1:54 PM EDT.