A newer version of this visualization is available.
Daily Arctic Sea Ice - Summer 2009
Sea ice is frozen seawater floating on the surface of the ocean. Some sea ice is semi-permanent, persisting from year to year, and some is seasonal, melting and refreezing from season to season. The sea ice cover reaches its minimum extent at the end of each summer and the remaining ice is called the perennial ice cover.
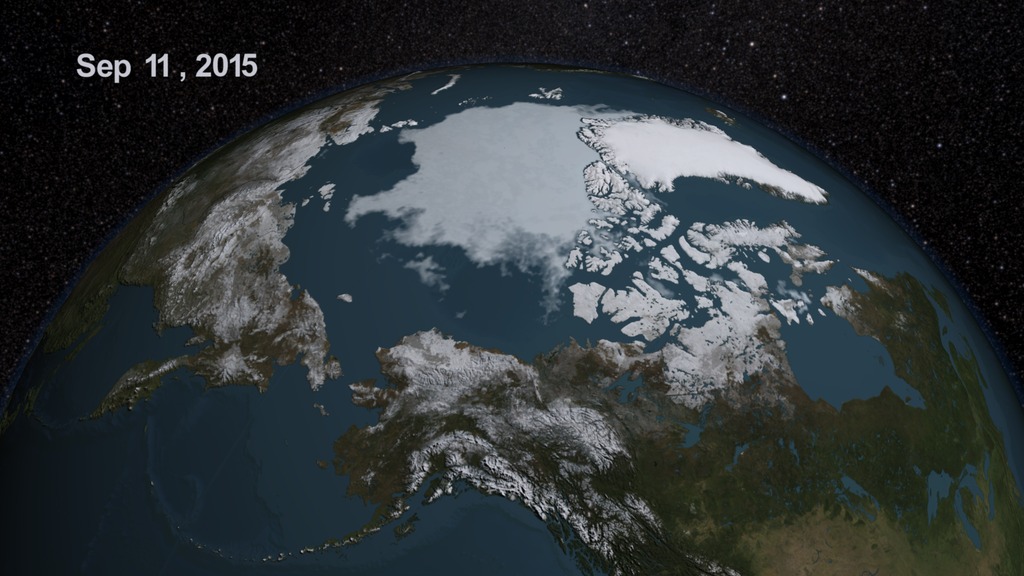
Duing the summer of 2009, the arctic sea ice reached its minimum extent on September 12th. The 2009 minimum extent was the third lowest extent measured since the beginning of the satellite record in 1979. This animation shows the summer retreat of sea ice over the Arctic from 7/1/2009 through 9/12/2009. The sea ice was defined by a 3-day moving average of the AMSR-E 12.5 km sea ice concentration, showing the region where the sea ice concentration was greater than 15%. The false color of the sea ice was derived from the AMSR-E 6.25 km brightness temperature.
This animation shows the retreat of the sea ice over the Arctic from 7/1/2009 through 9/12/2009
.
Credits
Please give credit for this item to:
NASA/Goddard Space Flight Center Scientific Visualization Studio
-
Visualizer
-
Cindy Starr
(Global Science and Technology, Inc.)

-
Cindy Starr
(Global Science and Technology, Inc.)
-
Animator
- Trent L. Schindler (UMBC)
-
Producer
- Laura Motel (UMBC)
Series
This page can be found in the following series:Datasets used
-
Daily L3 6.25 km 89 GHz Brightness Temperature (Tb) [Aqua: AMSR-E]
ID: 236 -
Sea Ice Concentration (Level 3 12.5 km Sea Ice Concentration) [Aqua: AMSR-E]
ID: 608
Note: While we identify the data sets used on this page, we do not store any further details, nor the data sets themselves on our site.
Newer Versions
- ID: 4684
 Visualization
 - ID: 4355
 Visualization
Release date
This page was originally published on Monday, September 7, 2009.
This page was last updated on Wednesday, May 3, 2023 at 1:54 PM EDT.