Aqua/AIRS Sees Belt of Carbon Dioxide in Southern Hemisphere
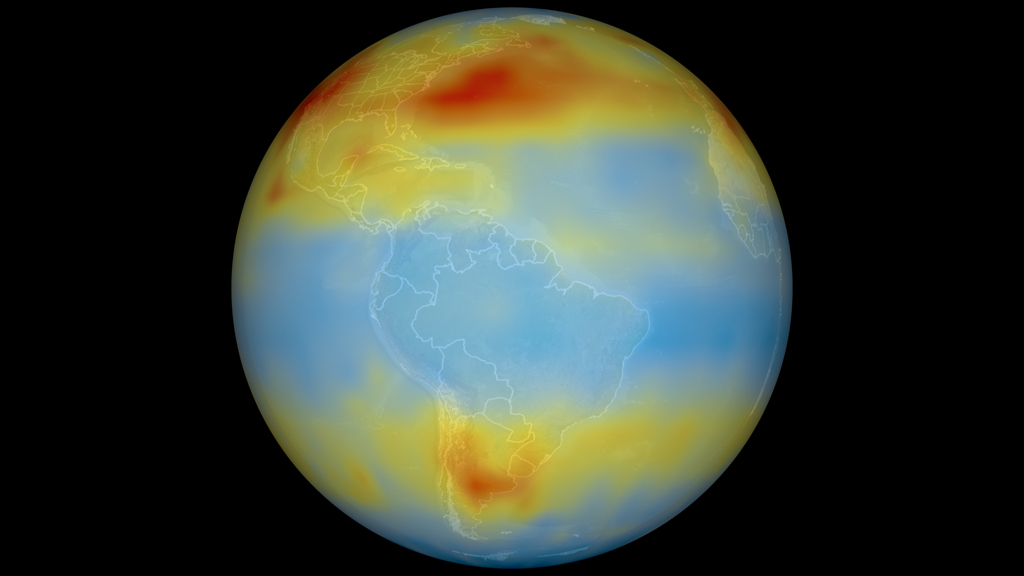
Although originally designed to measure atmospheric water vapor and temperature profiles for weather forecasting, data from the Atmospheric Infrared Sounder (AIRS) instrument on NASA's Aqua spacecraft are now also being used by scientists to observe atmospheric carbon dioxide. In the southern hemisphere, a belt of mid-tropospheric air containing enhanced concentrations of carbon dioxide emerged between 30 and 40 degrees south latitude. This belt had not previously been seen in any chemistry transport model. Subtropical storms track through this region, as do the cloud bands of the intertropical convergence zone near the equator, an area of low atmospheric pressure that forms where northeast and southeast trade winds meet.
The researchers believe strong convection (thunderstorms) in this belt, and South America's high Andes Mountains, lift carbon dioxide from major sources on Earth's surface, such as the respiration of plants, forest fires and facilities for producing synthetic fuels and generating power. This carbon dioxide is then carried into the 'free troposphere,' the part of the troposphere that is too high to be influenced by Earth's surface. There, it becomes trapped in the mid-latitude jet stream, which transports it rapidly around the world.
For more information on AIRS, visit the AIRS Project Web Site: http://airs.jpl.nasa.gov. The AIRS data products are available at http://daac.gsfc.nasa.gov/AIRS/index.shtml.
In the 1950's, the South African government decided to produce gasoline and chemicals from their plentiful natural supply of coal. The South African Coal liquidation plant also exports carbon dioxide. This image shows AIRS carbon dioxide data from July 2003.

Electrical plants in eastern Australia also export carbon dioxide to the mid-troposphere. This image shows AIRS carbon dioxide data from July 2003.
South America Biogenesis seen in AIRS carbon dioxide concentration data from July 2003.

Colortable for the carbon dioxide
Credits
Please give credit for this item to:
NASA/Goddard Space Flight Center and NASA/Jet Propulsion Laboratory Scientific Visualization Studio
-
Animators
- Lori Perkins (NASA/GSFC)
- Greg Shirah (NASA/GSFC)
-
Scientists
- Moustafa Chahine (NASA/JPL CalTech)
- Tom Pagano (NASA/JPL CalTech)
- Edward Olsen (NASA/JPL CalTech)
Release date
This page was originally published on Tuesday, October 7, 2008.
This page was last updated on Wednesday, May 3, 2023 at 1:55 PM EDT.
Series
This visualization can be found in the following series:Datasets used in this visualization
-
Wind [Aqua: AIRS]
ID: 589
Note: While we identify the data sets used in these visualizations, we do not store any further details, nor the data sets themselves on our site.
Related
- ID: 10854
 Produced Video