Change in Elevation over Greenland with Alternate Color Scale
Changes in the Greenland and Antarctic ice sheets are critical in quantifying forecasts for sea level rise. Since its launch in January 2003, the ICESat elevation satellite has been measuring the change in thickness of these ice sheets. This image of Greenland shows the changes in elevation over the Greenland ice sheet between 2003 and 2006, The white regions indicate a slight thickening, while the blue shades indicate a thinning of the ice sheet. Gray indicates areas where no change in elevation was measured.

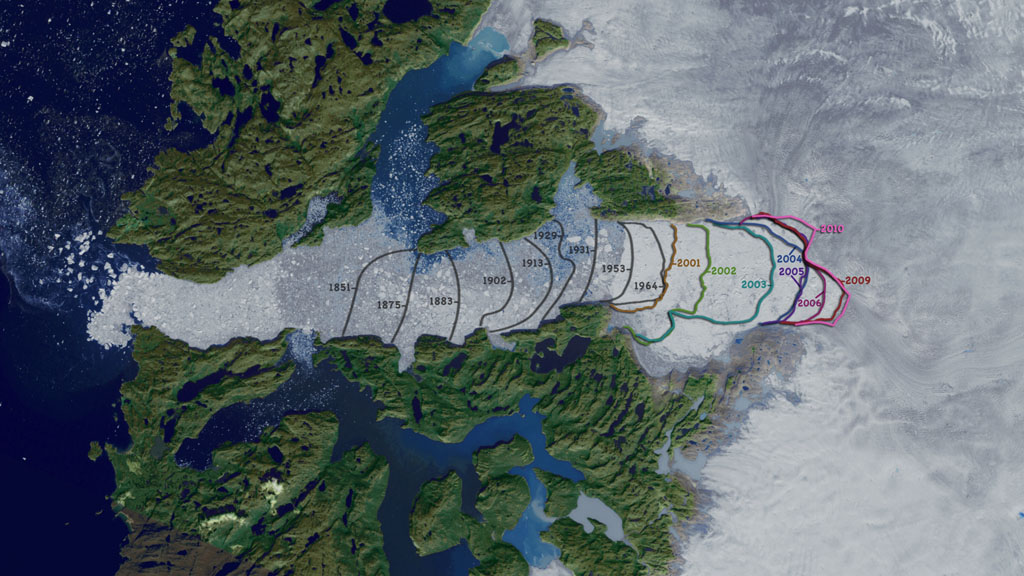
This image shows changes in the elevation over the Greenland ice sheet as colors displayed over topography of Greenland measured by ICESat.
Credits
Please give credit for this item to:
NASA/Goddard Space Flight Center Scientific Visualization Studio
The Next Generation Blue Marble data is courtesy of Reto Stockli (NASA/GSFC).
-
Visualizer
-
Cindy Starr
(Global Science and Technology, Inc.)

-
Cindy Starr
(Global Science and Technology, Inc.)
-
Animator
- Helen-Nicole Kostis (UMBC)
-
Scientists
- Jay Zwally (NASA/GSFC)
- Waleed Abdalati (NASA/GSFC)
Missions
This page is related to the following missions:Datasets used
-
[ICESat: GLAS]
ID: 38 -
September Sea Ice Concentration Anomaly [Nimbus-7: SSMR]
ID: 421 -
Monthly Average Precipitation [TRMM: PR and TMI]
ID: 516This dataset can be found at: http://disc.sci.gsfc.nasa.gov/data/datapool/TRMM/01_Data_Products/index.html
See all pages that use this dataset
Note: While we identify the data sets used on this page, we do not store any further details, nor the data sets themselves on our site.
Related
- ID: 10763
 Produced Video
Release date
This page was originally published on Friday, September 21, 2007.
This page was last updated on Wednesday, May 3, 2023 at 1:55 PM EDT.