Arctic Sea Ice Maximum Concentrations 1979-2006
This visualization shows the annual maximum amount of winter Arctic ice from 1979 to 2006. In 2005 and 2006, the winter ice maximum was about 6% smaller than the average winter ice over the 26 year period. The expected winter ice retreat is 1.5 to 2% loss per decade. The same data is also shown with a yellow region representing the cumulative or maximum extent of winter ice observed from 1979 to 2006.
Arctic sea ice maximum extent 1979-2006
Arctic sea ice maximum extent (1979-2006) with solid cumulative area in the background

Date overlays 1979-2006
Arctic sea ice maximum extent 1979-2006 with dates
Arctic sea ice maximum extent (1979-2006) with solid cumulative area in the background and with dates
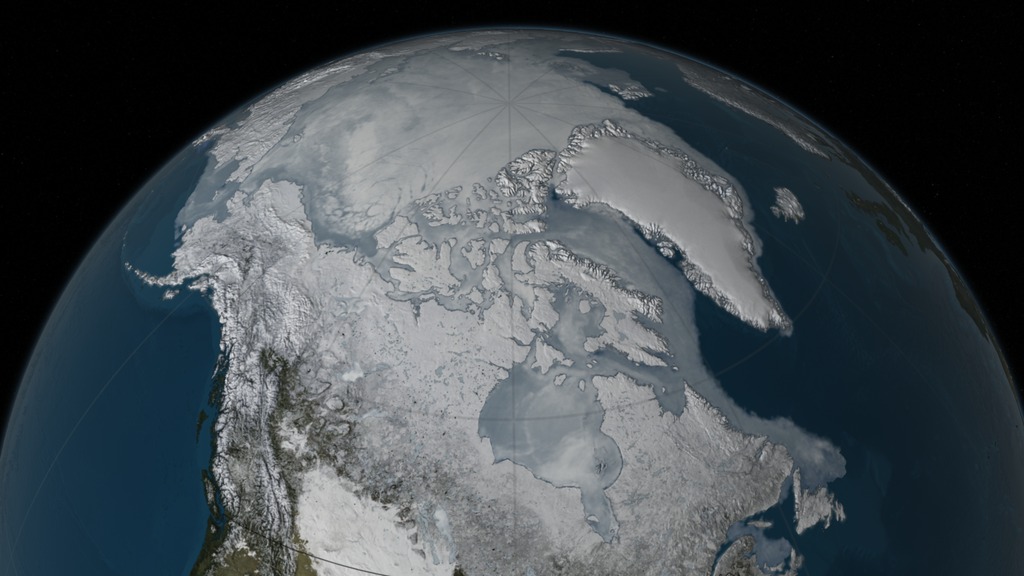
2006 Arctic sea ice maximum extent (10 March 2006)
2006 Arctic sea ice maximum extent (10 March 2006) with solid cumulative area for 1979-2006
2006 Arctic sea ice maximum extent (10 March 2006) with outline
Sea ice cumulative maximum extent overlay outline for 1979-2006
Credits
Please give credit for this item to:
NASA/Goddard Space Flight Center Scientific Visualization Studio
-
Animator
-
Greg Shirah
(NASA/GSFC)

-
Greg Shirah
(NASA/GSFC)
-
Scientist
- Josefino Comiso (NASA/GSFC)
Datasets used
-
[DMSP: SSM/I]
ID: 11Defense Meteorological Satellite Program Special Sensor Microwave Imager
See all pages that use this dataset -
Comiso's Yearly Maximum Sea Ice Concentration
ID: 541
Note: While we identify the data sets used on this page, we do not store any further details, nor the data sets themselves on our site.
Related
- ID: 4440
 Visualization
Release date
This page was originally published on Wednesday, September 13, 2006.
This page was last updated on Wednesday, May 3, 2023 at 1:55 PM EDT.