A newer version of this visualization is available.
Atlantic Hurricane/Storm Summary
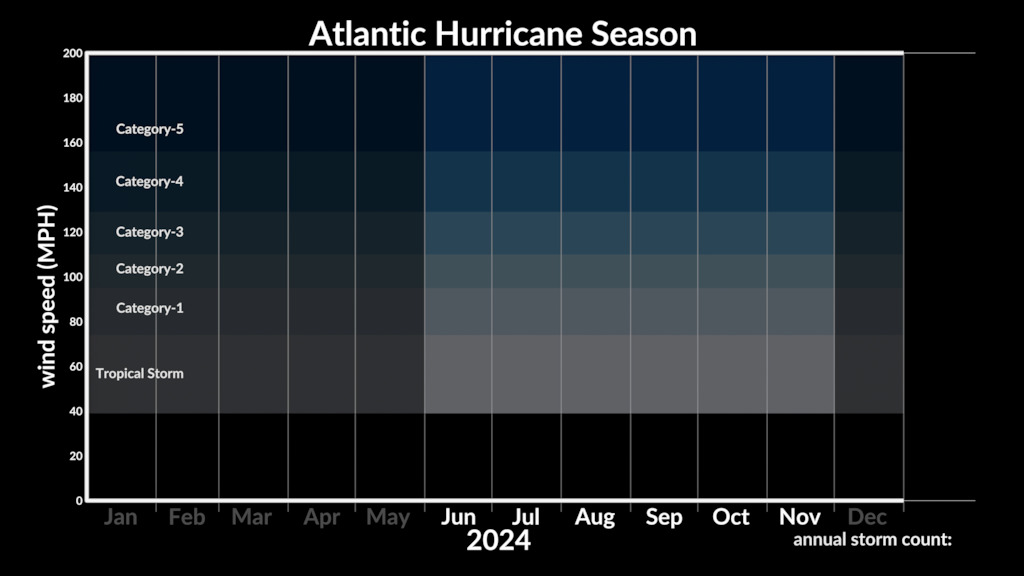
These still images shows plots of time vs. wind speed for each tropical storm/hurricane of the Atlantic Hurricane seasons. Horizontal lines indicate wind speed category thresholds. A line plot for each storm shows the storm's name and a marker at the peak wind speed.
The plot for the current year automatically updates every 2 hours during hurricane season.

2018 Atlantic hurricanes and storms

2017 Atlantic hurricanes and storms

2016 Atlantic hurricanes and storms
2015 Atlantic hurricanes and storms
2014 Atlantic hurricanes and storms
2013 Atlantic hurricanes and storms
2012 Atlantic hurricanes and storms
2011 Atlantic hurricanes and storms
2010 Atlantic hurricanes and storms
2009 Atlantic hurricanes and storms
2008 Atlantic hurricanes and storms
2007 Atlantic hurricanes and storms
2006 Atlantic hurricanes and storms
2005 Atlantic hurricanes and storms
2004 Atlantic hurricanes and storms
2003 Atlantic hurricanes and storms
2002 Atlantic hurricanes and storms
2001 Atlantic hurricanes and storms
Credits
Please give credit for this item to:
NASA/Goddard Space Flight Center Scientific Visualization Studio Storm wind speeds provided by NOAA's National Weather Service via UNISYS
-
Animator
-
Greg Shirah
(NASA/GSFC)

-
Greg Shirah
(NASA/GSFC)
Datasets used
-
Hurricane/Tropical Data
ID: 282
Note: While we identify the data sets used on this page, we do not store any further details, nor the data sets themselves on our site.
Newer Versions
- ID: 5072
 Visualization
Release date
This page was originally published on Tuesday, June 13, 2006.
This page was last updated on Wednesday, May 3, 2023 at 1:55 PM EDT.