NASA and Agriculture: From Seeds to Satellites
- Produced by:
- Kathleen Gaeta
- View full credits
Movies
- ComClas_Final_Cut.mp4 (1920x1080)
- ComClas_Final_Cut.webm (1920x1080)
Images
- ComClas_Final_Cut.00148_print.jpg (1024x576)
- Screen_Shot_2022-03-03_at_1.29.01_PM.png (2478x1382)
- ComClas_Final_Cut.00148_thm.png (80x40)
- ComClas_Final_Cut.00148_searchweb.png (320x180)
- ComClas_Final_Cut.00148_web.png (320x180)
Right click movies to download them if they automatically play in your browser.
Complete transcript available.
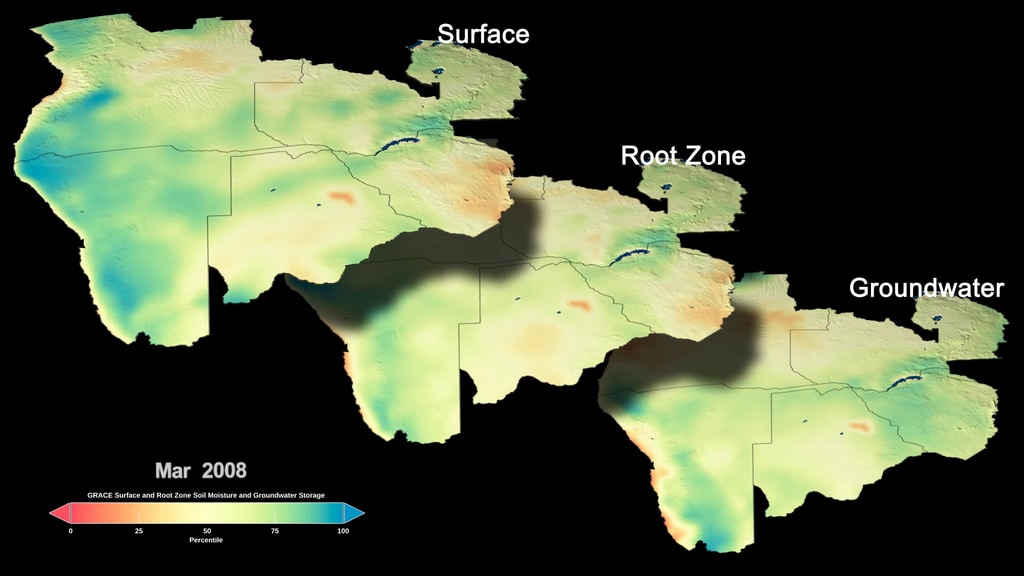
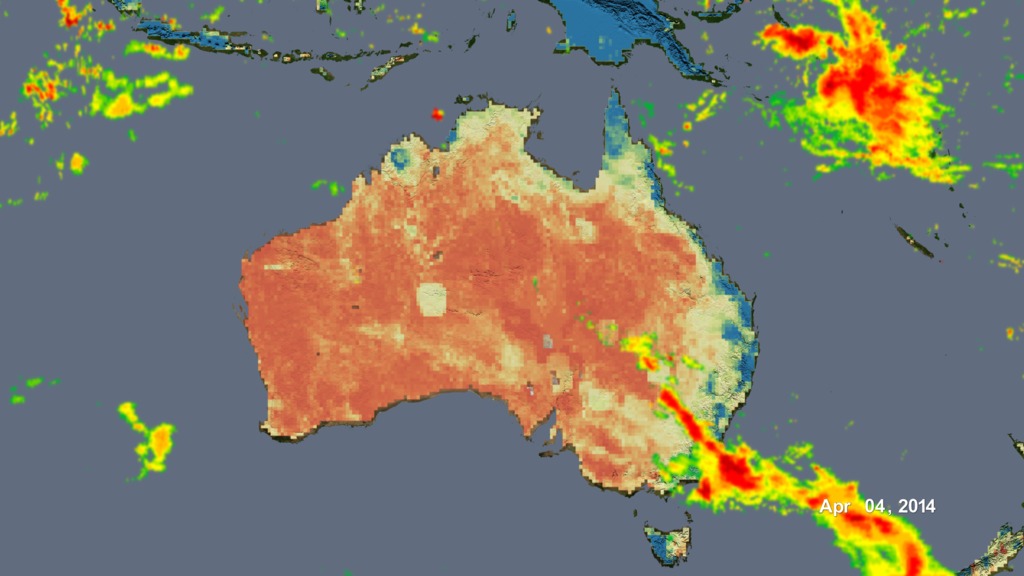
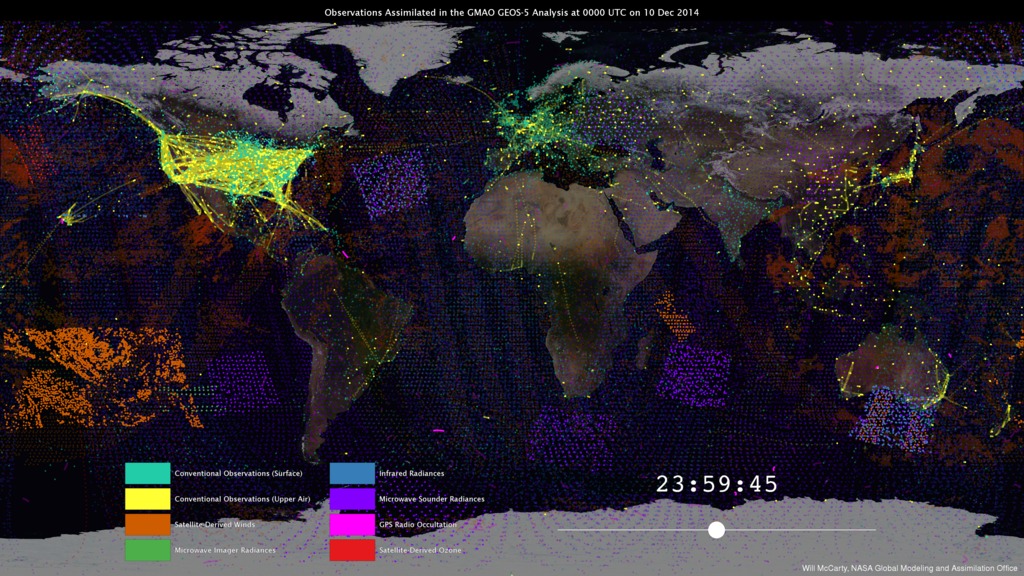
NASA satellites, data, missions, and programs have been put to use for decades to strengthen food security, track droughts and flooding, determine plant and soil health and otherwise support agriculture decision making. With observations from space and aircraft, combined with high-end computer modeling, NASA works with partner agencies, organizations, farmers, ranchers, and decision makers to share our understanding of the relationship between the Earth system and the environments that provide us food. Working with local communities and decision makers to determine their needs and how they can best use Earth observation data, NASA supports those who address issues like water management for irrigation, crop-type identification and land use, coastal and lake water quality monitoring, drought preparedness, and famine early warnings.
Credits
Please give credit for this item to:
NASA's Scientific Visualization Studio
Writers
- Aries Keck (ADNET)
- Christopher Thorne (ADNET)
Producer
- Kathleen Gaeta (AIMM) [Lead]
Series
This visualization can be found in the following series:Related pages
GPM and Transportation and Logistics
Nov. 2, 2020, 2 a.m.
Read moreMusic: Universal Production MusicComplete transcript available. In a series of three half-day virtual meetings, this workshop will focus on current applications and future opportunities of NASA precipitation and cloud data products to support transport and logistical activities for aviation, maritime, roads and highway transportation systems. The workshop will bring together representatives from federal and state operational agencies and private companies to discuss how NASA precipitation and cloud products could be better leveraged to inform decision-making for transport and logistical operations. The workshop will also provide an opportunity for end-users to engage with Global Precipitation Measurement (GPM) mission and the Aerosol, Clouds, Convection and Precipitation (ACCP) Designated Observable Study Team to address current satellite use and challenges as well as future satellite needs.
GRACE Data Assimilation and GEOS-5 Forecasts
March 30, 2020, 8 p.m.
Read moreGRACE Surface Water, Root Zone, and Groundwater Storage, Okovango Delta Region NASA researchers have developed new satellite-based, weekly global maps of soil moisture and groundwater wetness conditions and one to three-month U.S. forecasts of each product. While maps of current dry/wet conditions for the United States have been available since 2012, this is the first time they have been available globally.Both the global maps and the U.S. forecasts use data from NASA and German Research Center for Geosciences’s Gravity Recovery and Climate Experiment Follow On (GRACE-FO) satellites, a pair of spacecraft that detect the movement of water on Earth based on variations of Earth’s gravity field. GRACE-FO succeeds the highly successful GRACE satellites, which ended their mission in 2017 after 15 years of operation. With the global expansion of the product, and the addition of U.S. forecasts, the GRACE-FO data are filling in key gaps for understanding the full picture of wet and dry conditions that can lead to drought.The satellite-based observations of changes in water distribution are integrated with other data within a computer model that simulates the water and energy cycles. The model then produces, among other outputs, time-varying maps of the distribution of water at three depths: surface soil moisture, root zone soil moisture (roughly the top three feet of soil), and shallow groundwater. The maps have a resolution of 1/8th degree of latitude, or about 8.5 miles, providing continuous data on moisture and groundwater conditions across the landscape.The new forecast product that projects dry and wet conditions 30, 60, and 90 days out for the lower 48 United States uses GRACE-FO data to help set the current conditions. Then the model runs forward in time using the Goddard Earth Observing System, Version 5 seasonal weather forecast model as input. The researchers found that including the GRACE-FO data made the resulting soil moisture and groundwater forecasts more accurate. GRACE Surface Water, Root Zone, and Groundwater Storage, Australia GRACE Surface Water, Root Zone, and Groundwater Storage, Australian Drought Dec 2019 GRACE Surface Water, Root Zone, and Groundwater Storage, Europe GRACE Groundwater Storage, Whole Earth 2018 GRACE Data AssimilationFour images in dropdown menu, one for each month. 2018 GEOSV2 ForecastsFour images in dropdown menu, one for each month. 2019 GRACE Data AssimilationFour images in dropdown menu, one for each month. 2019 GEOSV2 ForecastsFour images in dropdown menu, one for each month. Percentile Color Bar, All Water Storage Percentile COlor Bar, Groundwater Storage Only
Landsat Croplands Data Overview
Nov. 27, 2019, 7 a.m.
Read moreThe U.S. Department of Agriculture tracks how many acres and the annual yield for every crop produced. One method used to estimate crop acreage and yield is remote-sensing data from the NASA-USGS Landsat satellite program. The program started in 1997,with North Dakota, and by 2008 covered the entire lower 48 states and the District of Columbia. Music: s Curious Universe podcast. Annual top 10 crops in Cropland Data Layer for 2019. USDA, National Agricultural Statistics Service (NASS) uses NASA data from Landsat to generate an annual crop-specific land cover data layer for the continental United States. THis is the annual crop data for 2021. USDA, National Agricultural Statistics Service (NASS) uses NASA data from Landsat to generate an annual crop-specific land cover data layer for the continental United States. THis is the annual crop data for 2022.
NASA-USDA-FAS Soil Moisture / IMERG
March 29, 2016, 8 p.m.
Read moreSoil Moisture / Precipitation in Australia, Absolute This visualization shows the correlation and lag time of surface soil moisture following precipitation events over Australia, India, and the United States. It uses the new NASA-USDA-FAS Soil Moisture product, a joint effort of NASA and the USDA Foreign Agricultural Service, and the global Integrated Multi-satellitE Retrievals for GPM (IMERG) precipitation dataset, which provides rainfall rates for the entire world every thirty minutes. This animation shows the 30-minute rainfall product, while the soil moisture data is a three-day moving average. Anomaly data is expressed as a standardized anomaly, e.g. (value-average)/stdev, and as such is unitless.For more detailed information about the soil moisture product:http://www.pecad.fas.usda.gov/cropexplorer/description.aspx?legendid=355Bolten, J. D., W. T. Crow, T. J. Jackson, X. Zhan, and C. A. Reynolds (2010), Evaluating the utility of remotely-sensed soil moisture retrievals for operational agricultural drought monitoring, IEEE J. Sel. Topics Appl. Earth Obs., 3(1), 57–66. Soil Moisture / Precipitation in Australia, Absolute, with Colorbar Soil Moisture / Precipitation in Australia, Anomaly Soil Moisture / Precipitation in Australia, Anomaly with Colorbar Soil Moisture / Precipitation in Australia, Anomaly, Hyperwall Resolution Soil Moisture / Precipitation in India, Absolute Soil Moisture / Precipitation in India, Absolute with Colorbar Soil Moisture / Precipitation in India, Anomaly Soil Moisture / Precipitation in India, Anomaly with Colorbar Soil Moisture / Precipitation in United States, Absolute Soil Moisture / Precipitation in United States, Absolute with Colorbar Soil Moisture / Precipitation in United States, Anomaly Soil Moisture / Precipitation in United States, Anomaly with Colorbar Colorbar, Soil Moisture, Absolute Colorbar, Soil Moisture, Anomaly Colorbar, IMERG Soil Moisture / Precipitation in Peru, Absolute Soil Moisture / Precipitation in Peru, Absolute with Colorbar Soil Moisture / Precipitation in Peru, Anomaly Soil Moisture / Precipitation in Peru, Anomaly with Colorbar Soil Moisture / Precipitation over the entire globe, Anomaly with Colorbar
From Observations to Models
May 7, 2015, 6 a.m.
Read moreThis animation shows the global observations assimilated into the GEOS-5 data assimilation system over 6 hours. Data assimilation occurs four times per day. NASA’s Global Modeling and Assimilation Office (GMAO) uses the Goddard Earth Observing System Model, Version 5 Data Assimilation System (GEOS-5 DAS) to produce global numerical weather forecasts on a routine basis. GMAO forecasts play important roles in managing NASA’s fleet of science satellites and in researching the impact of new satellite observations. In order to provide timely information about the state of the atmosphere for NASA instrument teams and researchers, the GMAO runs the GEOS-5 DAS four times each day in real time. For each forecast, it is necessary to provide accurate initial conditions that drive the GEOS-5 forecasts. To do this, the best estimate of the full, three-dimensional atmospheric state is determined by combining the latest observations and a short-term, 6-hour forecast—a process known as data assimilation. The GEOS-5 DAS assimilates more than 5 million observations during each 6-hour assimilation period.These observations are assembled from a number of sources from around the globe, including NASA, NOAA, EUMETSAT (European Organization for the Exploitation of Meteorological Satellites), commercial airlines, the US Department of Defense, and many others. Similarly, each observation type has its own sampling characteristics. It can be seen in the animation how different observation types have different strategies. One of the main challenges of data assimilation is to understand how all these observations are alike, how they differ, and how they interact with each other.Funding for the development of the GEOS-5 model and data assimilation system development comes from NASA s contribution to the Joint Center for Satellite Data Assimilation.The GEOS-5 DAS runs at the NASA Center for Climate Simulation, which is funded by NASA’s High-End Computing Program.For More Information:http://gmao.gsfc.nasa.gov/http://www.nccs.nasa.gov/images/data_assim_story_072815.pdf This animation shows the global observations (top-left) assimilated into the GEOS-5 DAS over 6 hours and various subsets of these observations. Sources include NASA observations (top-center), NOAA and EUMETSAT operational temperature and moisture sounders (top-right), conventional upper air observations (middle-left), conventional surface observations (middle-center), satellite-derived ozone measurements (middle-right), satellite-derived wind measurements (bottom-left), and GPS radio occultation (bottom-center). Legend showing the observation types assimilated into the GEOS-5 data assimilation system.