COVID-19: NASA Satellite Data Show Drop in Air Pollution Over U.S.
Tropospheric NO2 Column, March 15-April 15 2015-2019 average vs. 2020, USA regions
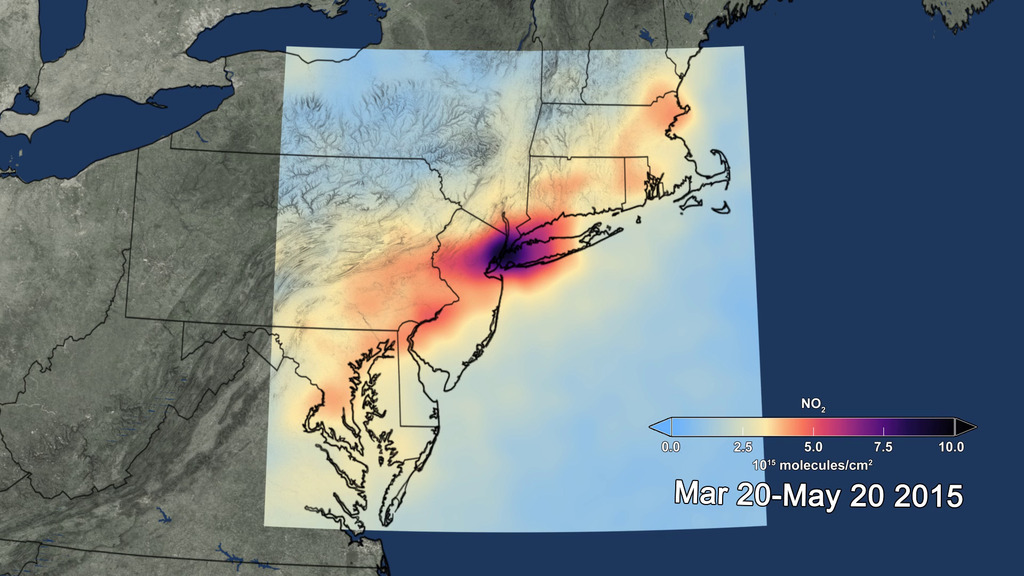
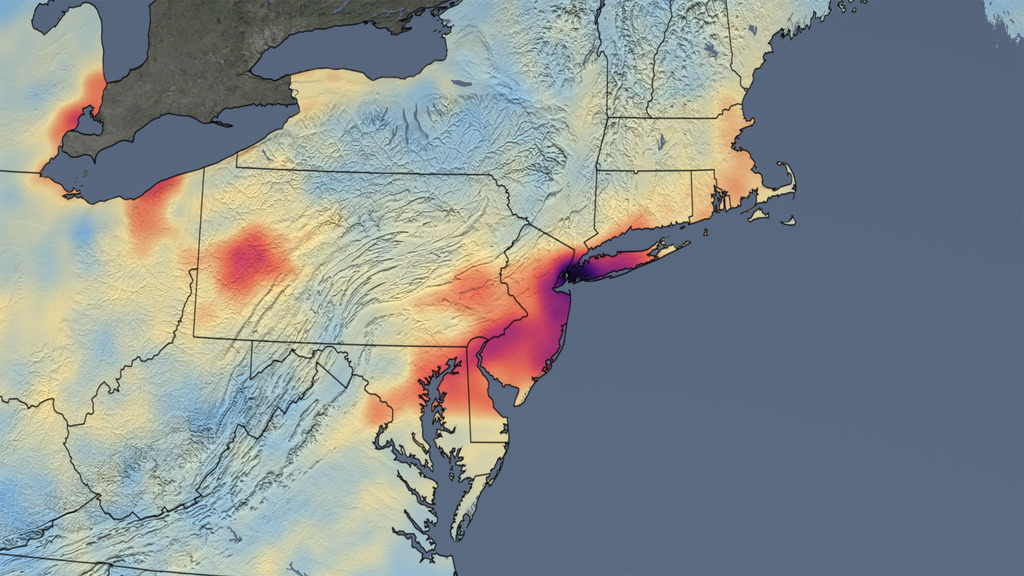
These images show the impact the spread of the novel coronavirus (COVID-19) has had on reducing air pollution in the United States as widespread lockdowns and shelter-in-place orders have been put in place. The images show a reduction in the levels of nitrogen dioxide (NO2)—a noxious gas emitted by motor vehicles, power plants, and industrial facilities—as measured by the Ozone Monitoring Instrument (OMI) on NASA’s Aura satellite in March 2020. The “without stay-at-home orders” images show average monthly NO2 concentrations during March and April from 2015 through 2019, while the “during stay-at-home orders” images show average monthly concentrations in March and April 2020.
These improvements in air quality have come at a high cost, as communities grapple with the impacts of COVID-19. The data indicate that the NO2 levels in March and April 2020 are much lower on average across the United States when compared to the mean of 2015 to 2019.
Tropospheric NO2 Column, March 2015-2019 average vs. 2020, Northeast USA
Tropospheric NO2 Column, March 15-April 15 2015-2019 average vs. 2020, Southeast USA
Tropospheric NO2 Column, March 15-April 15 2015-2019 average vs. 2020, Florida
Tropospheric NO2 Column Animation, With Total Mass Inset
Credits
Please give credit for this item to:
NASA's Goddard Space Flight Center
-
Data visualizer
- Trent L. Schindler (USRA)
-
Scientists
- Bryan Duncan (NASA/GSFC)
- Joanna Joiner (NASA/GSFC)
- Lok Lamsal (USRA)
-
Writers
- Bryan Duncan (NASA/GSFC)
- Heather Hanson (Global Science and Technology, Inc.)
-
Animator
- Amy Moran (Global Science and Technology, Inc.)
-
Technical support
- Ian Jones (ADNET Systems, Inc.)
- Laurence Schuler (ADNET Systems, Inc.)
Datasets used
-
[Aura: OMI]
ID: 147 -
Ozone [Aura: OMI]
ID: 264 -
BMNG (Blue Marble: Next Generation) [Terra and Aqua: MODIS]
ID: 508Credit: The Blue Marble data is courtesy of Reto Stockli (NASA/GSFC).
This dataset can be found at: http://earthobservatory.nasa.gov/Newsroom/BlueMarble/
See all pages that use this dataset
Note: While we identify the data sets used on this page, we do not store any further details, nor the data sets themselves on our site.
Sources
- ID: 5325
- ID: 4810
Used as a Source In
- ID: 13799
![Music: Organic Machine by Bernhard Hering [GEMA] and Matthias Kruger [GEMA]Complete transcript available.](/vis/a010000/a013700/a013799/2020Temp.png) Produced Video
Produced Video
Release date
This page was originally published on Monday, May 18, 2020.
This page was last updated on Tuesday, November 12, 2024 at 12:00 PM EST.