Earth: A System of Systems (updated)
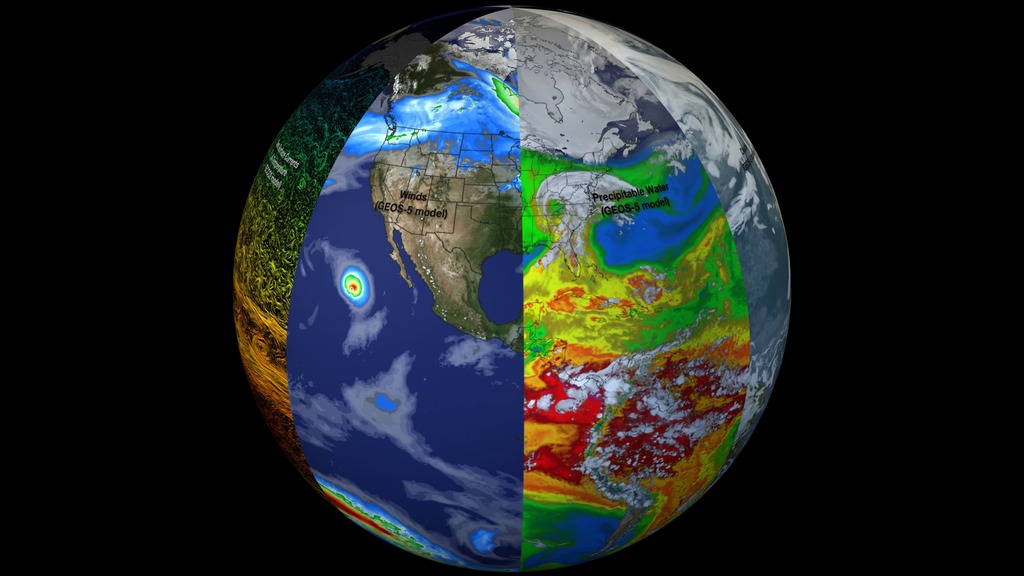
All six time-synchronous datasets, individually and then layered two at a time
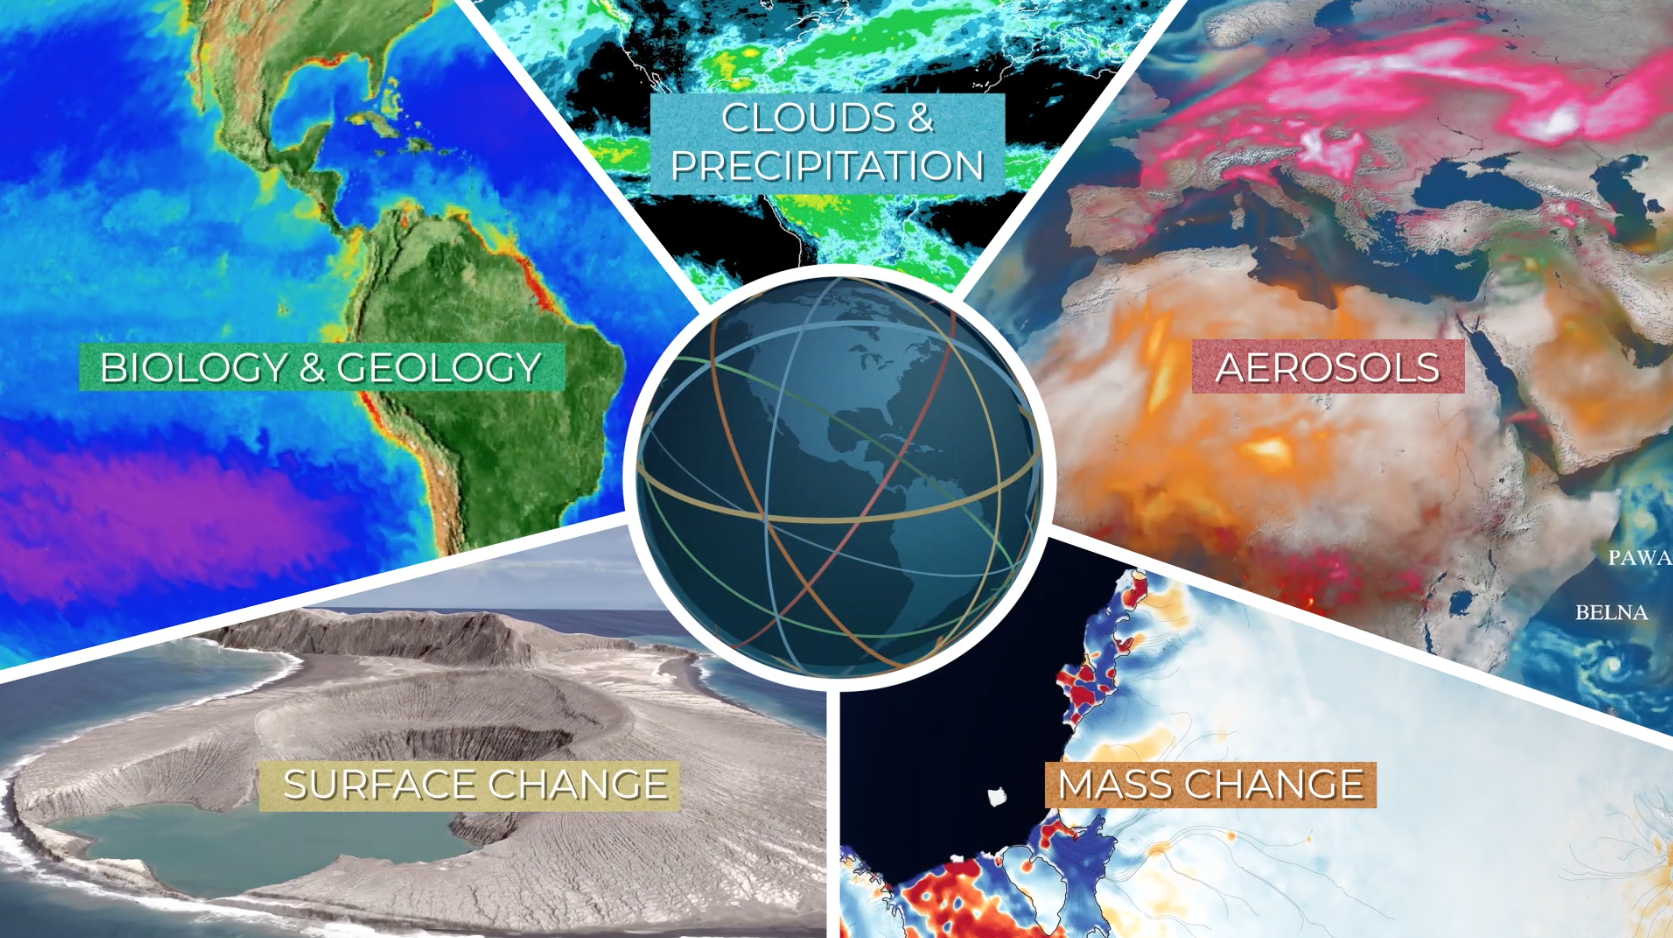
In order to study the Earth as a whole system and understand how it is changing, NASA develops and supports a large number of Earth-observing missions. These missions provide Earth science researchers the necessary data to address key questions about global climate change.
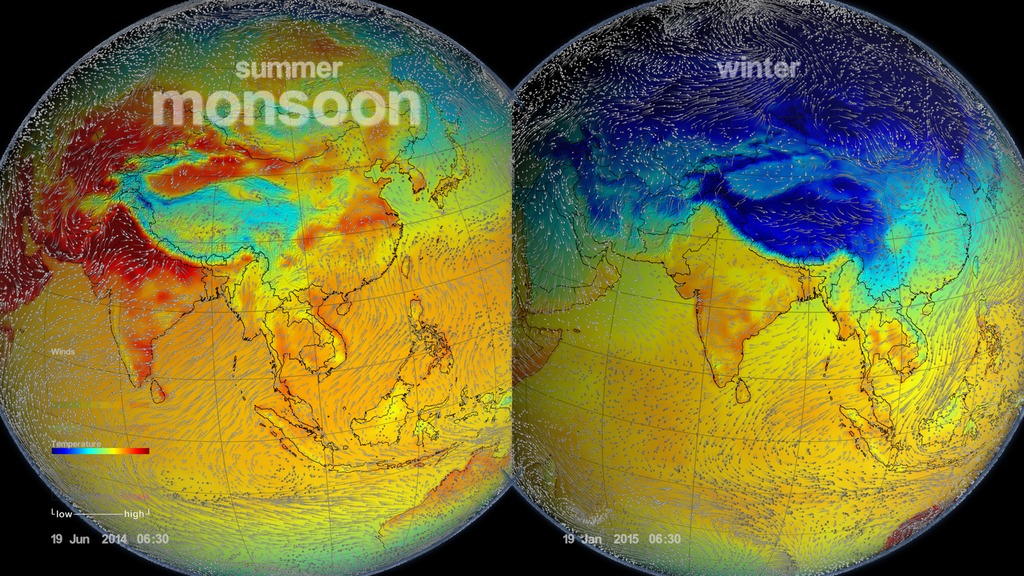
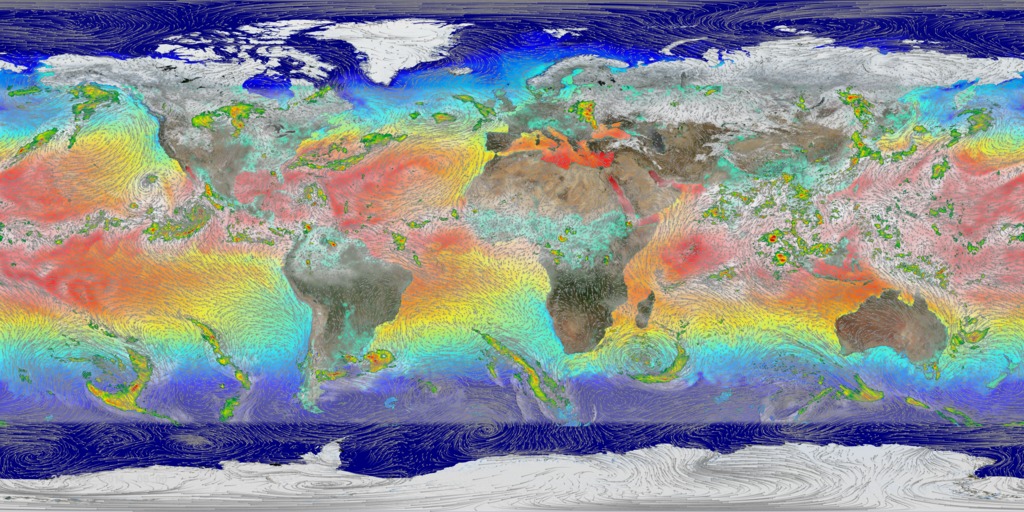
This visualization reveals that the Earth system, like the human body, comprises diverse components that interact in complex ways. Shown first, the Multi-Scale Ultra-High Resolution (MUR) sea surface temperature (SST) dataset combines data from the Advanced Very High-Resolution Radiometer (AVHRR), Moderate Imaging Spectroradiometer (MODIS) Terra and Aqua, and Advanced Microwave Spectroradiometer-EOS (AMSR-E) instruments. Constantly released into the Earth’s atmosphere, heat and moisture from the ocean and land influence Earth’s weather patterns—represented here as wind speeds from the Modern-Era Retrospective analysis for Research and Applications (MERRA) dataset. Moisture in the atmosphere—represented as water vapor (also from MERRA)—forms clouds (shown here using cloud layer data from the NOAA Climate Prediction Center) and precipitation. Precipitation (data from GPM IMERG) significantly impacts water availability, which influences soil moisture (data from NASA-USDA-FA) and ocean salinity.
While scientists learn a great deal from studying each of these components individually, improved observational and computational capabilities increasingly allow them to study the interactions between these interrelated geophysical and biological parameters, leading to unprecedented insight into how the Earth system works—and how it might change in the future.
- AMSR-E
- Atmosphere
- Atmospheric Composition
- Atmospheric science
- Atmospheric Water Vapor
- Beachball
- Clouds
- Earth Science
- HDTV
- Hyperwall
- IMERG
- Land Surface
- MERRA
- MODIS
- NOAA
- Ocean Temperature
- Oceans
- Physical oceanography
- precipitation
- Presentation
- sea surface temperature
- Soil Moisture/Water Content
- Soil science
- Soils
- Water Vapor
- Weather and Atmospheric Dynamics
- Wind Patterns
Credits
Please give credit for this item to:
NASA's Goddard Space Flight Center
-
Animators
- Amy Moran (Global Science and Technology, Inc.)
- Horace Mitchell (NASA/GSFC)
-
Data visualizers
-
Greg Shirah
(NASA/GSFC)

-
Alex Kekesi
(Global Science and Technology, Inc.)
- Trent L. Schindler (USRA)
- Lori Perkins (NASA/GSFC)
-
Greg Shirah
(NASA/GSFC)
-
Scientists
- Dalia B Kirschbaum (NASA/GSFC)
-
George Huffman
(NASA/GSFC)
- Gail Skofronick Jackson (NASA/GSFC)
Datasets used
-
Soil Moisture [GEMS]
ID: 405GEMS stands for Goddard Earth Modeling System. It is also known as the NSIPP Global Climate Model.
See all pages that use this dataset -
CPC (Climate Prediction Center) Cloud Composite
ID: 600Global cloud cover from multiple satellites
See all pages that use this dataset -
MERRA
ID: 684 -
IMERG
ID: 863This dataset can be found at: http://pmm.nasa.gov/sites/default/files/document_files/IMERG_ATBD_V4.4.pdf
See all pages that use this dataset -
Global Flood Monitoring System (GFMS)
ID: 901
Note: While we identify the data sets used on this page, we do not store any further details, nor the data sets themselves on our site.
Alternate Versions
- ID: 30701
 Hyperwall Visual
Sources
- ID: 4397
 Visualization
 - ID: 4439
Used as a Source In
- ID: 14043
 Produced Video
 - ID: 13909
 Produced Video
 - ID: 4920
 Visualization
 - ID: 13799
![Music: Organic Machine by Bernhard Hering [GEMA] and Matthias Kruger [GEMA]Complete transcript available.](/vis/a010000/a013700/a013799/2020Temp.png) Produced Video
Produced Video
Release date
This page was originally published on Friday, May 8, 2020.
This page was last updated on Sunday, March 2, 2025 at 12:37 AM EST.