Soil Moisture, Salinity and Precipitation
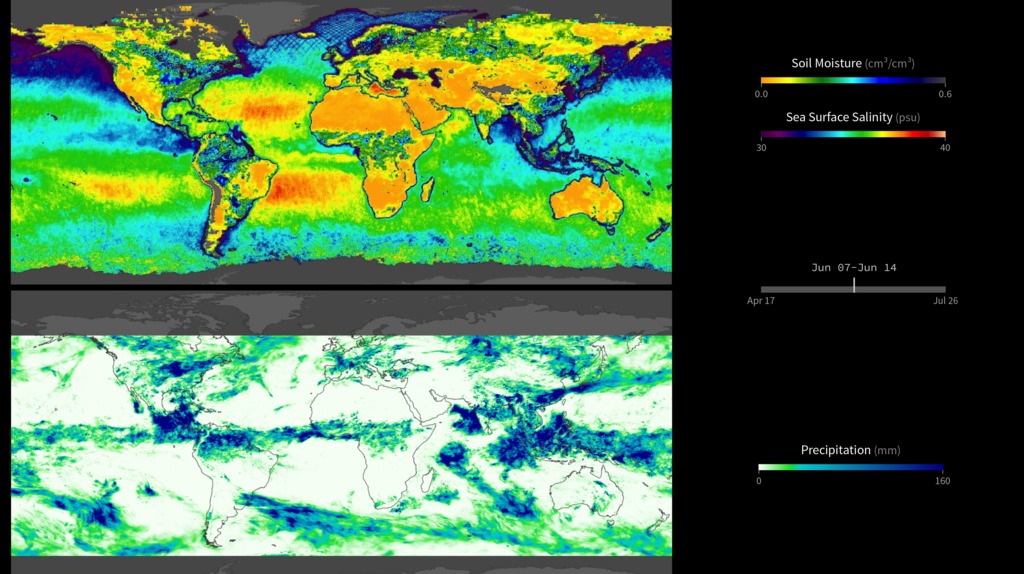
Global maps shown the relationship between precipitation, soil moisture, and salinity.
This visualization compares weekly soil moisture and sea surface salinity data (over land and water, respectively) from NASA’s Soil Moisture Active Passive Satellite (SMAP) mission [top map] with a precipitation product called Integrated Multi-satellite Retrievals for GPM, or IMERG [bottom map], from March 31 2015 to March 24, 2019. IMERG is These maps reveal how precipitation amounts influence soil moisture conditions and sea surface salinity. For example, high amounts of precipitation along the equator coincide with relatively moist soil conditions on land (blue shades) and low salinity values in the ocean (green and blue shades). Conversely, areas that receive little or no precipitation, such as the Sahara Desert in northern Africa, coincide with dry soils (dark yellow shades). Scientists can use data from SMAP and IMERG to develop improved flood prediction and drought monitoring capabilities. Societal benefits include improved water-resource management, agricultural productivity, and wildfire and landslide predictions. Data from SMAP also allow us to extend the data record of the highly successful 3-year Aquarius sea surface salinity mission into the future. The images shown here are 8-day averages.
May 2019, mid-west US
September 2018, Hurricane Florence
May-Dec 2018, Indian Subcontinent
Credits
Please give credit for this item to:
NASA
-
Scientists
- Rajat Bindlish (USDA-ARS Hydrology and Remote Sensing Laboratory)
- Simon Yueh (NASA/JPL CalTech)
- Dara Entekhabi (MIT)
- Peggy O'Neill (NASA/GSFC)
- Steven Chan (JPL)
- Jared Entin (NASA/HQ)
-
Visualizer
- Marit Jentoft-Nilsen (Global Science and Technology, Inc.)
Datasets used
-
IMERG
ID: 863This dataset can be found at: http://pmm.nasa.gov/sites/default/files/document_files/IMERG_ATBD_V4.4.pdf
See all pages that use this dataset -
Soil Moisture [SMAP: Radiometer]
ID: 1051Level 3 enhanced daily composite soil moisture
This dataset can be found at: https://smap.jpl.nasa.gov/data/
See all pages that use this dataset -
Salinity (Sea Surface Salinity) [SMAP: Radiometer]
ID: 1052SMAP Level 3 Sea Surface Salinity Standard Mapped Image 8-Day Running Mean V3.0 70km Validated Dataset
This dataset can be found at: https://podaac.jpl.nasa.gov/dataset/SMAP_RSS_L3_SSS_SMI_8DAY-RUNNINGMEAN_V3_70KM?ids=Platform:ProcessingLevel&values=SMAP:*3*
See all pages that use this dataset
Note: While we identify the data sets used on this page, we do not store any further details, nor the data sets themselves on our site.
Older Versions
- ID: 30698
 Hyperwall Visual
Release date
This page was originally published on Monday, July 15, 2019.
This page was last updated on Monday, February 3, 2025 at 12:50 AM EST.