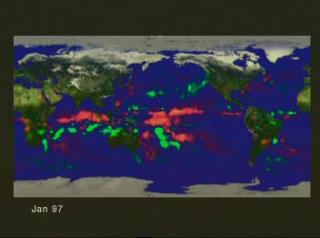
Global Rainfall Anomalies from TRMM: January, 1997, through February, 1998 (Version 1)
The term 'rainfall anomalies' means the differences in rainfall from a normal year.
Global monthly average precipitation anomalies as measured by TRMM for January 1997 through February 1998

Color bar for precipitation anomalies
Credits
Please give credit for this item to:
NASA/Goddard Space Flight Center
Scientific Visualization Studio
-
Animator
-
Greg Shirah
(NASA/GSFC)

-
Greg Shirah
(NASA/GSFC)
-
Scientist
- Chris Kummerow (NASA/GSFC)
Missions
This page is related to the following missions:Series
This page can be found in the following series:Datasets used
-
Monthly Average Precipitation Anomaly [TRMM: PR and TMI]
ID: 517This dataset can be found at: http://disc.sci.gsfc.nasa.gov/data/datapool/TRMM/01_Data_Products/index.html
See all pages that use this dataset
Note: While we identify the data sets used on this page, we do not store any further details, nor the data sets themselves on our site.
Alternate Versions
- ID: 311
Release date
This page was originally published on Monday, December 7, 1998.
This page was last updated on Wednesday, May 3, 2023 at 1:59 PM EDT.