Hurricane Matthew Rainfall Totals
Total rainfall from Hurricane Matthew
In 2016, Hurricane Matthew was a very powerful, long-lived and deadly tropical cyclone that became the first Category 5 Atlantic hurricane since Hurricane Felix in 2007. The storm travelled across the Western Atlantic, including parts of Haiti, Cuba, Dominican Republic and Lucayan Archipelago, the southeastern United States, and the Canadian Maritimes.
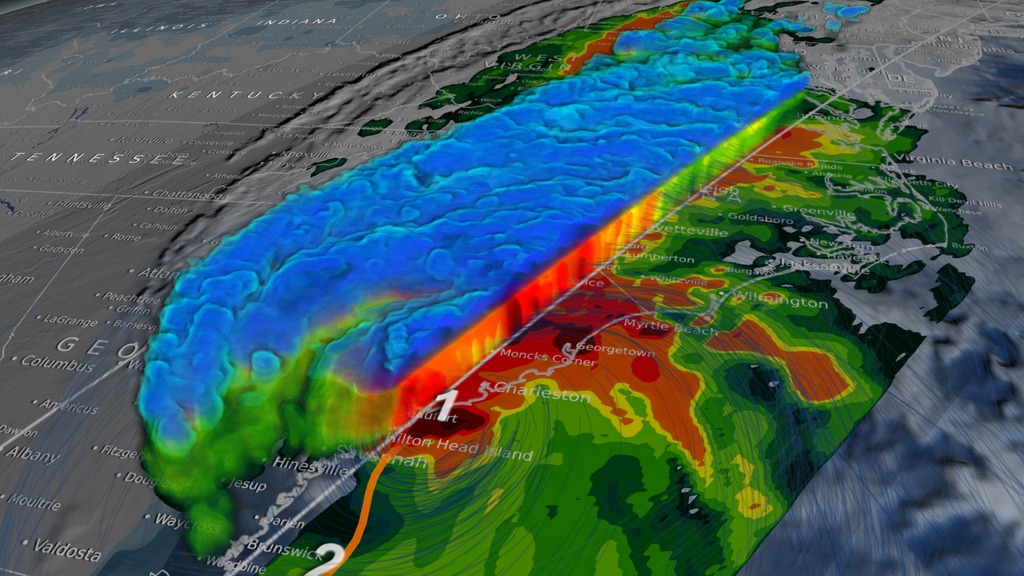
This visualization shows the amount of rainfall dropped by Hurricane Matthew over the life and track of the storm from September 28 – October 10, 2016, using the global Integrated Multi-satellite Retrievals from GPM (IMERG) precipitation dataset. Hurricane Matthew’s interaction with a frontal boundary caused extreme rainfall in North Carolina resulting in over 20 inches (508 mm) of rain being reported in some locations. The area was already saturated before Hurricane Matthew arrived. Heavy rainfall from a slow moving low and frontal system moved through during the last week of September. Maximum rainfall total estimates for the real-time IMERG product have been adjusted to reflect observed values.
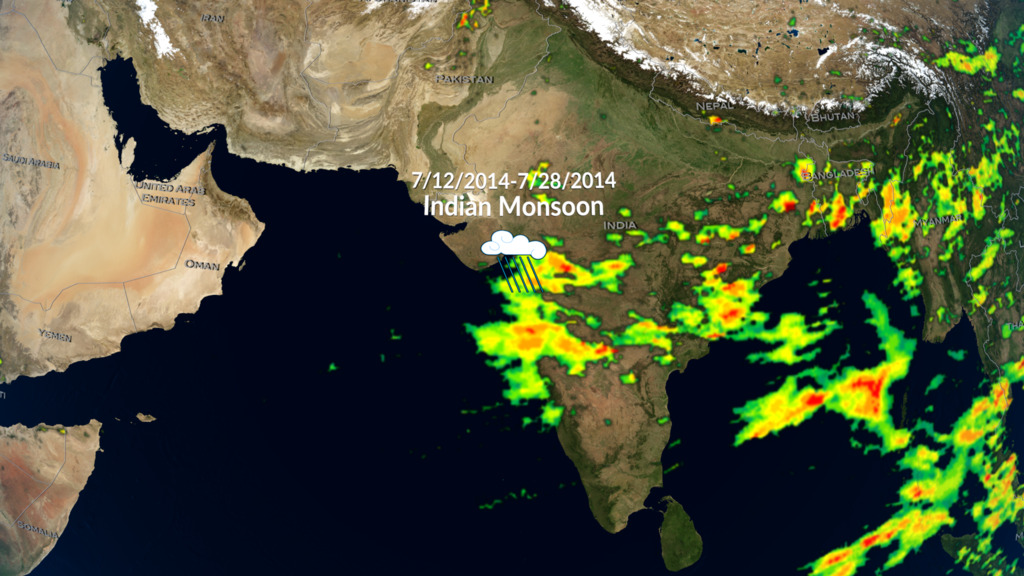
The global IMERG precipitation dataset provides rainfall rates for the entire world every 30 minutes. IMERG is derived using data from the Global Precipitation Measurement (GPM) mission—a network of international satellites including the GPM Core Observatory.
For More Information
Credits
Please give credit for this item to:
NASA's Goddard Space Flight Center
-
Visualizer
- Harold Pierce (SSAI)
-
Technical support
- Marit Jentoft-Nilsen (Global Science and Technology, Inc.)
Datasets used
-
IMERG
ID: 863This dataset can be found at: http://pmm.nasa.gov/sites/default/files/document_files/IMERG_ATBD_V4.4.pdf
See all pages that use this dataset
Note: While we identify the data sets used on this page, we do not store any further details, nor the data sets themselves on our site.
Release date
This page was originally published on Monday, November 14, 2016.
This page was last updated on Sunday, January 5, 2025 at 12:29 AM EST.

