A newer version of this visualization is available.
Sea Surface Height Anomaly
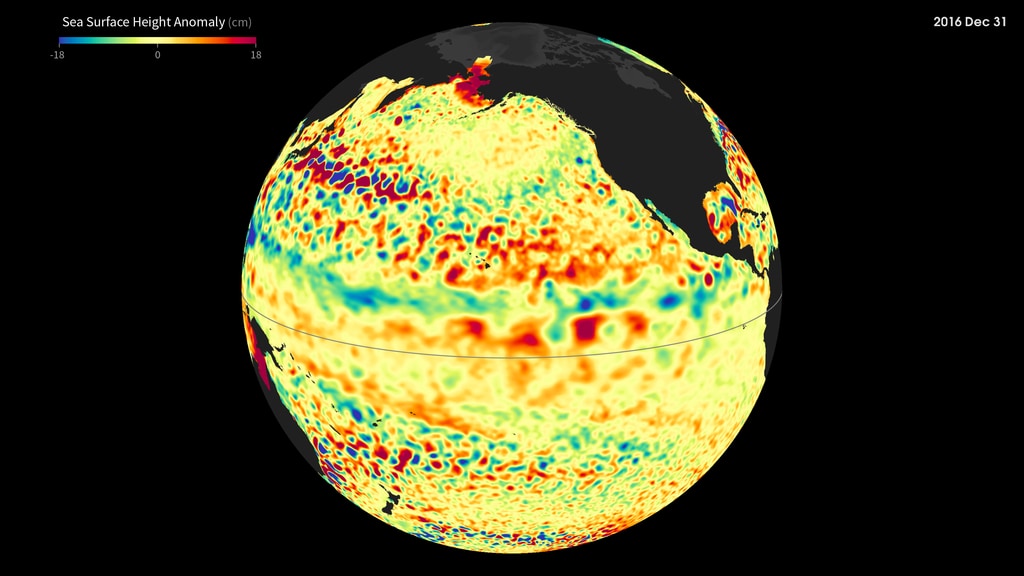
Sea Surface Height Anomaly during the 2015-2016 El Niño
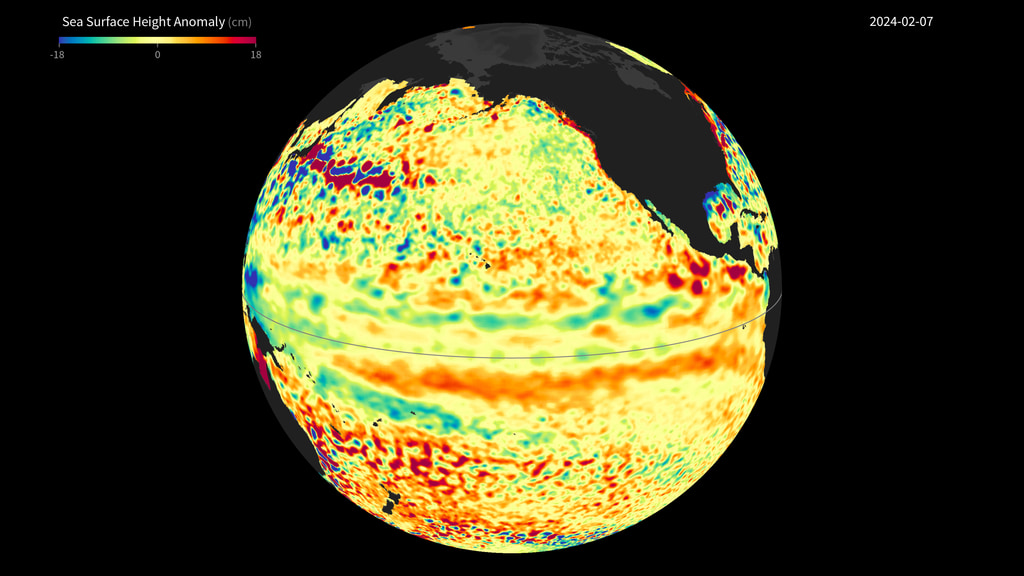
El Niño is characterized by unusually warm ocean temperatures in the eastern equatorial Pacific. The warmer water associated with El Niño displaces colder water in the upper layer of the ocean causing an increase in sea surface height because of thermal expansion.
This visualization, created using a sea surface height anomaly product produced by AVISO, shows sea surface height anomalies (SSHA) from January 1, 2015 to January 22, 2016. The maps have been processed to highlight the interannual signal of SSH, i.e., the mean signal, seasonal signal, and the trend have been removed. Red and white shades indicate high sea surface heights relative to the reference state, while blue and purple shades indicate sea surface heights lower than the reference state. Neutral conditions appear green. After five consecutive months with sea surface temperatures 0.5 degrees Celsius above the long-term mean, NOAA issued an El Niño Advisory to declare the arrival of the phenomenon. A statement issued by the NOAA Climate Prediction Center on March 10, 2016, states that "A transition to ENSO-neutral is likely during late Northern Hemisphere spring or early summer 2016, with close to a 50 percent chance for La Niña conditions to develop by the fall.”
For More Information
Credits
Please give credit for this item to:
Visualization by NASA's Goddard Space Flight Center generated using data from E.U. Copernicus Marine Service.
-
Visualizer
- Marit Jentoft-Nilsen (Global Science and Technology, Inc.)
Datasets used
-
DT-MSLA-H (Maps of Sea Level Anomalies: Height - Delayed Time (Aviso+/CMEMS))
ID: 923Data processed from all altimeter missions: HY2, Saral/AltiKa, Cryosat-2, Jason-2, Jason-1, T/P, ENVISAT, GFO, ERS1/2.
This dataset can be found at: http://marine.copernicus.eu/web/69-interactive-catalogue.php?option=com_csw&view=details&product_id=SEALEVEL_GLO_SLA_MAP_L4_REP_OBSERVATIONS_008_027
See all pages that use this dataset -
NRT-MSLA-H (Maps of Sea Level Anomalies: Height - Near-Real Time (Aviso+/CMEMS))
ID: 924Data used from the most recent datasets available based on the enhanced OGDR+IGDR production.
This dataset can be found at: http://marine.copernicus.eu/web/69-interactive-catalogue.php?option=com_csw&view=details&product_id=SEALEVEL_GLO_SLA_MAP_L4_NRT_OBSERVATIONS_008_026
See all pages that use this dataset
Note: While we identify the data sets used on this page, we do not store any further details, nor the data sets themselves on our site.
Newer Versions
- ID: 31232
 Hyperwall Visual
 - ID: 30975
 Hyperwall Visual
Release date
This page was originally published on Tuesday, March 8, 2016.
This page was last updated on Monday, February 3, 2025 at 12:45 AM EST.