A newer version of this visualization is available.
Sea Ice Minimum Extent for 1979-2004
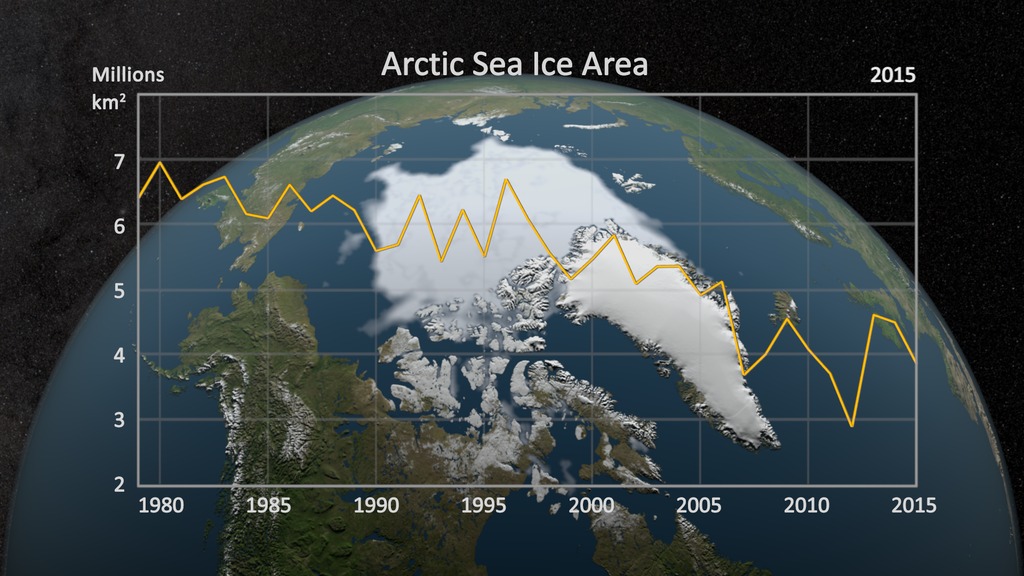
This animation shows the annual minimum sea ice extent and concentration for 25 years, from 1979 to 2004. The year 2002 showed lowest level of sea ice on record. This visualization was created in support of the December 2004 American Geophysical Union (AGU) meeting. NOTE: this version has a slightly different camera angle than the 2003 version, animation ID 2850 (the original camera angle was lost).
Sea ice minimum extents from 1979 to 2004

Sea ice minimum extent for 1979.
Sea ice minimum extent for 1980
Sea ice minimum extent for 1981
Sea ice minimum extent for 1982
Sea ice minimum extent for 1983
Sea ice minimum extent for 1984
Sea ice minimum extent for 1985
Sea ice minimum extent for 1986
Sea ice minimum extent for 1987
Sea ice minimum extent for 1988
Sea ice minimum extent for 1989
Sea ice minimum extent for 1990
Sea ice minimum extent for 1991
Sea ice minimum extent for 1992
Sea ice minimum extent for 1993
Sea ice minimum extent for 1994
Sea ice minimum extent for 1995
Sea ice minimum extent for 1996
Sea ice minimum extent for 1997
Sea ice minimum extent for 1998
Sea ice minimum extent for 1999
Sea ice minimum extent for 2000
Sea ice minimum extent for 2001
Sea ice minimum extent for 2002
Sea ice minimum extent for 2003
Sea ice minimum extent for 2004
Credits
Please give credit for this item to:
NASA/Goddard Space Flight Center
Scientific Visualization Studio
The Blue Marble Next Generation data is courtesy of Reto Stockli (NASA/GSFC) and NASA's Earth Observatory.
-
Animators
-
Greg Shirah
(NASA/GSFC)

- James W. Williams (Global Science and Technology, Inc.)
-
Greg Shirah
(NASA/GSFC)
-
Scientist
- Josefino Comiso (NASA/GSFC)
Missions
This page is related to the following missions:Datasets used
-
[DMSP: SSM/I]
ID: 11Defense Meteorological Satellite Program Special Sensor Microwave Imager
See all pages that use this dataset -
[GTOPO30]
ID: 415 -
BMNG (Blue Marble: Next Generation) [Terra and Aqua: MODIS]
ID: 508Credit: The Blue Marble data is courtesy of Reto Stockli (NASA/GSFC).
This dataset can be found at: http://earthobservatory.nasa.gov/Newsroom/BlueMarble/
See all pages that use this dataset -
Comiso's September Minimum Sea Ice Concentration
ID: 540
Note: While we identify the data sets used on this page, we do not store any further details, nor the data sets themselves on our site.
Newer Versions
- ID: 4435
 Visualization
Release date
This page was originally published on Monday, December 6, 2004.
This page was last updated on Wednesday, May 3, 2023 at 1:56 PM EDT.