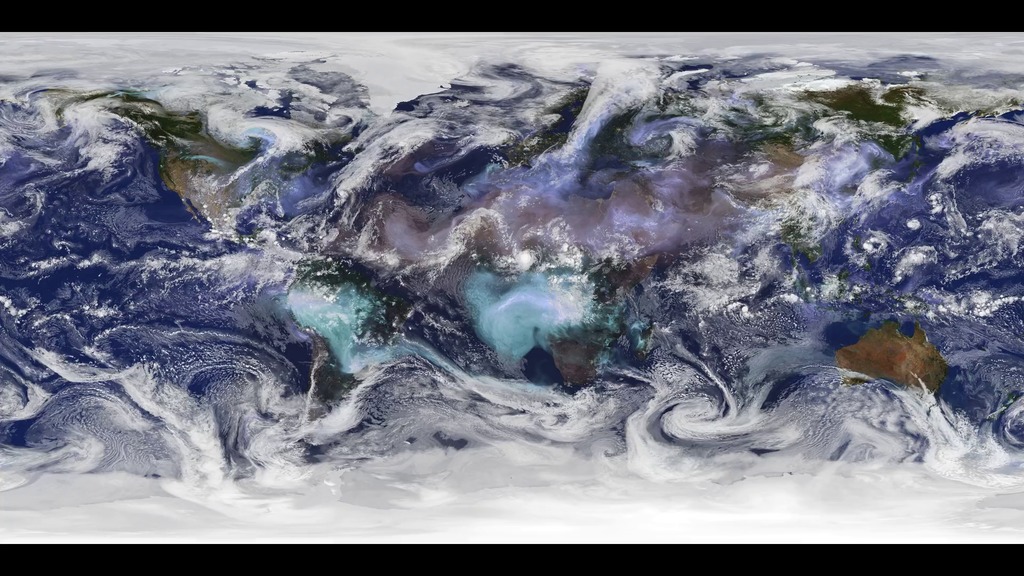
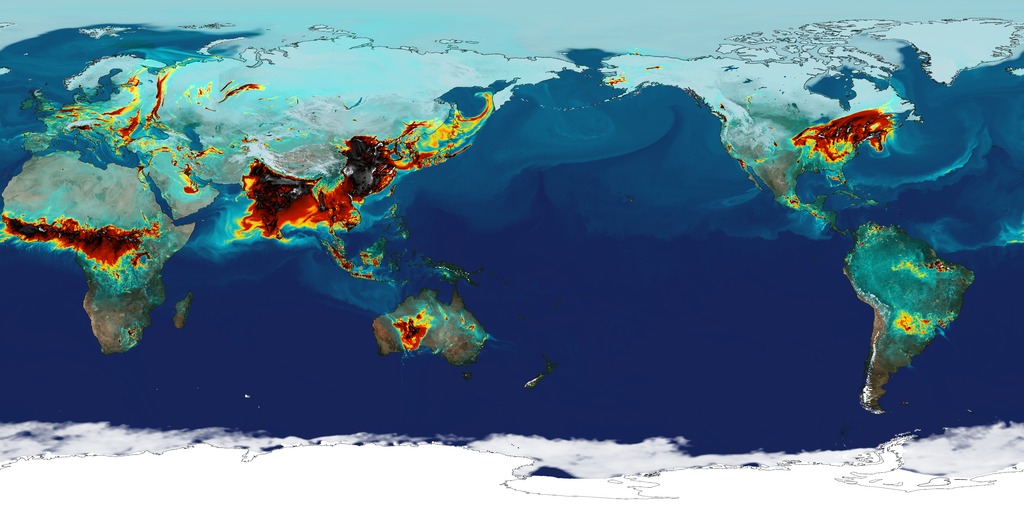
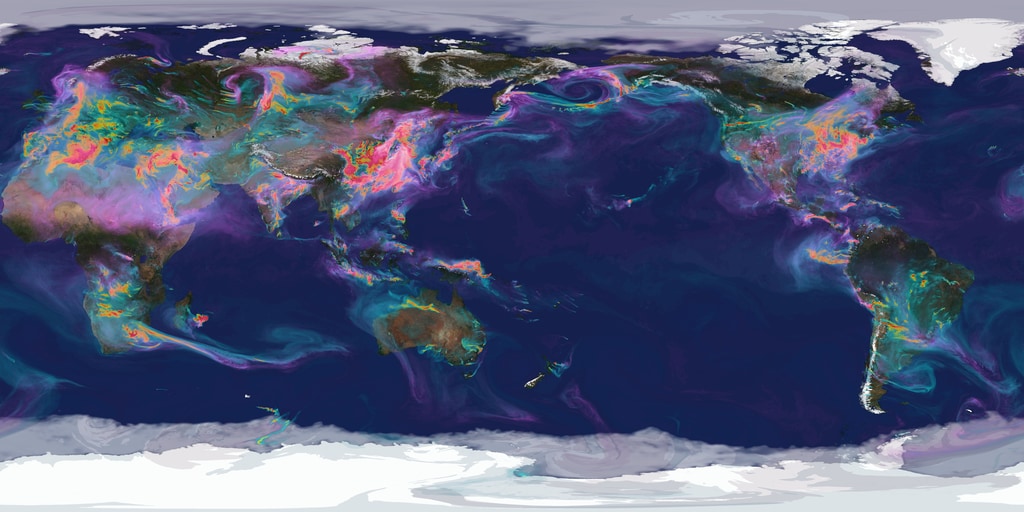
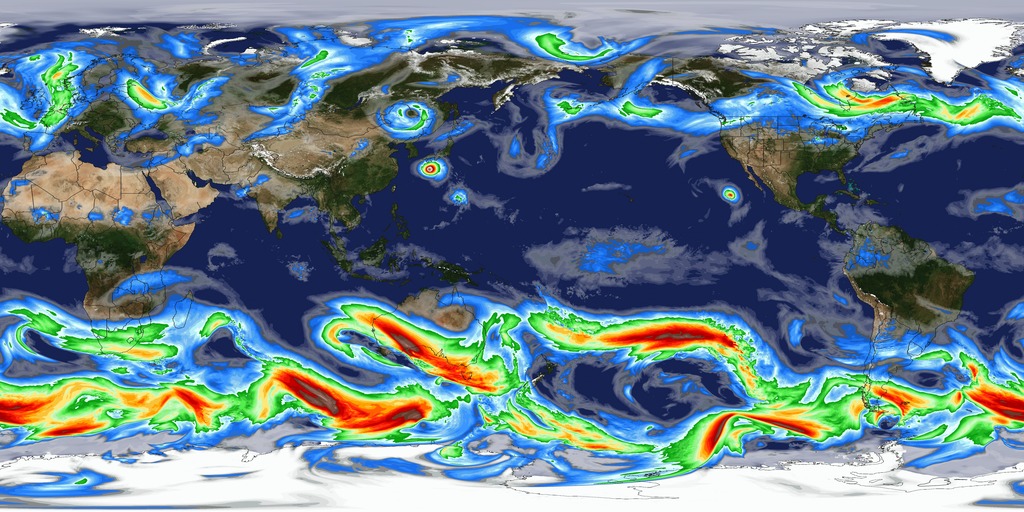
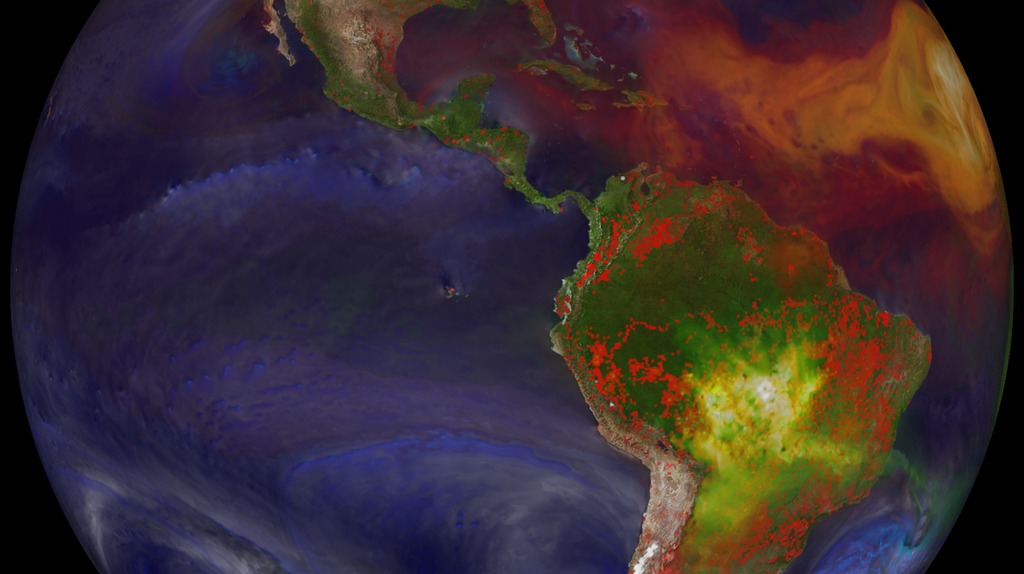
GEOS-5 Aerosols Simulation for SC 2014
- Visualizations by:
- William Putman
- View full credits
Movies
- 30637_aerosols_sim_1280x720_prores.mov (1280x720) [1.5 GB]
- aerosols-sc14.mp4 (1920x1080) [155.5 MB]
- aerosols-sc14.webm (1920x1080) [10.2 MB]
- 30637_aerosols_sim_1920x1080.mp4 (1920x1080) [204.3 MB]
- 30637_aerosols_sim_UHD_large.mp4 (3840x2160) [206.3 MB]
- 30637_aerosols_sim_UHD_youtube_hq.mov (3840x2160) [4.0 GB]
- 30637_aerosols_sim_UHD.mov (3840x2160) [11.2 GB]
- 30637_aerosols_sim_4K.mp4 (4096x2048) [206.8 MB]
- 30637_aerosols_sim_MASTER.mov (5760x2881) [23.5 GB]
Images
- aerosols-sc2014-preview.jpg (1024x512) [140.7 KB]
- aerosols_globe_c1440_NR_BETA9-SNAP_20070228_2200z_thm.png (80x40) [7.4 KB]
- aerosols_globe_c1440_NR_BETA9-SNAP_20070228_2200z_searchweb.png (320x180) [97.6 KB]
Frames
- frames/1920x1080_16x9_30p/aerosols/ (1920x1080) [179.3 KB]
- frames/5760x2881_2x1_30p/aerosols/ (5760x2881) [179.3 KB]
GEOS-5 aerosols shown at SC 2014.
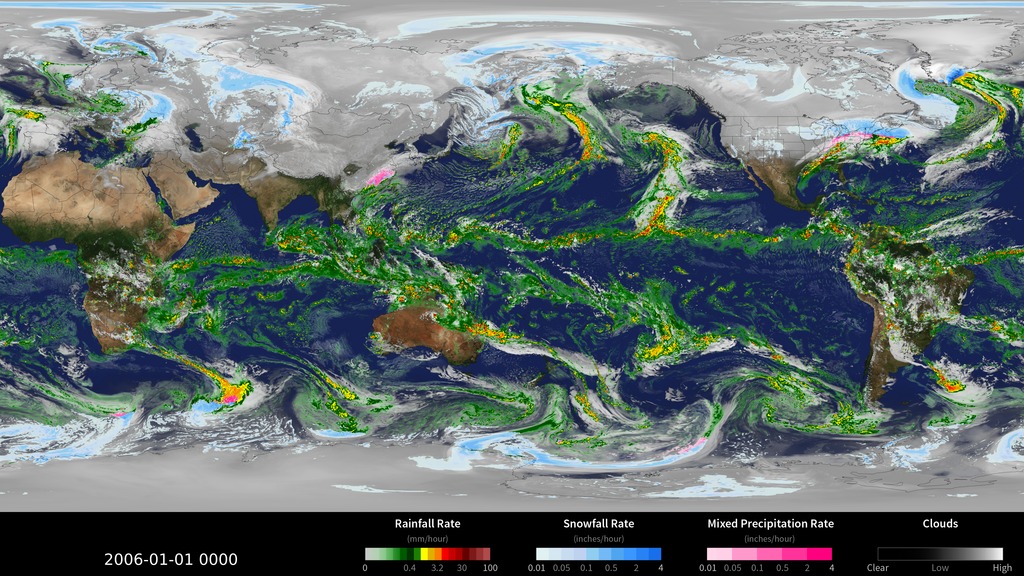
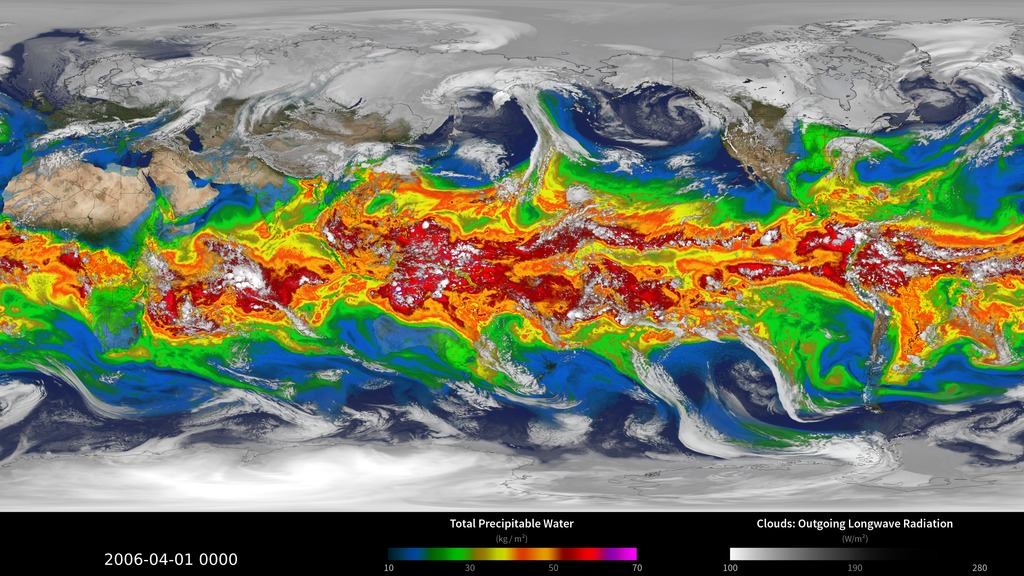
Credits
Please give credit for this item to:
NASA's Goddard Space Flight Center/Global Modeling and Assimilation Office
Animator
- William Putman (NASA/GSFC) [Lead]
Scientist
- William Putman (NASA/GSFC)
Project support
- Eric Sokolowsky (GST)
Related pages
Simulated Clouds and Aerosols
Dec. 10th, 2014
Read moreTiny solid and liquid particles suspended in the atmosphere are called aerosols. Windblown dust, sea salts, sulfates, smoke from wildfires, and pollution from factories are all examples of aerosols. Depending upon their size, type, and location, aerosols can either cool the surface, or warm it. They can help clouds to form, or they can inhibit cloud formation. And if inhaled, some aerosols can be harmful to people’s health. To study aerosols and their impact on clouds, researchers from NASA’s Global Modeling and Assimilation Office ran a simulation of the atmosphere that captured how winds transport aerosols around the world. This simulation, produced by the Goddard Earth Observing System Model Version 5 (GEOS -5), shows clouds (white), dust (brown shades), sulfates (purple shades), and organic black carbon (green shades) at 7-kilometer resolution from September 1, 2005 to December 31, 2005 (hourly). Simulations such as this one allow scientists to better understand how different types of aerosols travel in the atmosphere, impact cloud formation, and influence weather and climate. GEOS-5 Model Visible Iage from visualization with colorbars Related pages
Simulated Surface Carbon Monoxide
Dec. 10th, 2014
Read moreCarbon monoxide (CO) is a colorless, odorless, tasteless gas emitted primarily from bio- and fossil fuel combustion and forest fires. CO is regulated by the environmental protection agency because extremely high concentrations can cause harmful health effects. This simulation, produced by the Goddard Earth Observing System Model Version 5 (GEOS-5) at 7-kilometer resolution, shows carbon monoxide concentrations at Earth’s surface from December 1-31, 2006. In the atmosphere, CO has a lifetime of about one month resulting in the highest mixing ratios over source regions. The CO seen here primarily comes from fires burning in South America and Africa, and industrial activities taking place in urban areas such as Europe, Asia, and the United States. Atmospheric circulation quickly moves CO in concentrated masses, often transporting this pollutant from one continent to the next. Simulations such as this allow scientists to better understand the variability and transport of CO and show both the regional and global impacts of pollution. Carbon Monoxide animation of Dec 1 - 31, 2006 Related pages
Simulated Sulfur Dioxide and Sulfate Aerosols
Dec. 10th, 2014
Read moreSulfur dioxide (SO2) is an atmospheric pollutant that poses significant threats to human health. High concentrations of SO2 irritate the eyes, nose, and lungs, and can result in temporary breathing impairment. It is also a precursor to sulfuric acid, a major constituent of acid rain. SO2 is produced by the combustion of coal, fuel oil, and gasoline (since these fuels contain sulfur), and in the oxidation of naturally occurring sulfur gases, such as in volcanic eruptions. Volcanic plumes, rich in ash and SO2, are a hazard to aviation. Emitted SO2 is oxidized to form sulfate aerosols that that can alter the brightness of clouds and precipitation. Sulfate aerosols persist for long periods of time and can contribute to climate change. This simulation, produced by the Goddard Earth Observing System Model Version 5 (GEOS-5), shows SO2 and sulfate aerosols at 7-kilometer resolution from September 1, 2006 to December 31, 2006. Simulations such as this allow scientists to better understand how SO2 and sulfate aerosols travel through the atmosphere and impact Earth’s climate. Sulfur and Sulfates animation of Sept 1 - Dec 31, 2006 Related pages
Simulated Wind Speeds at 500 mb
Dec. 10th, 2014
Read moreThis simulation, produced by the Goddard Earth Observing System Model Version 5 (GEOS-5), shows 500 mb wind speeds at 7-kilometer resolution from August 1 to November 30, 2006, ranging from 0 to 135 knots (0 to 155 mph). The 500 mb wind speeds are often referred to as the “steering winds” of the atmosphere. Simulations such as this allow scientists to better understand global upper-level wind patterns that influence how weather systems such as cyclones and anticyclones move. In addition, scientists can study how atmospheric constituents such as aerosols can be transported from the surface to upper-levels. 500MB winds animation of Aug 1 - Nov 30, 2006 Related pages
Simulated Clouds and Precipitation
Dec. 10th, 2014
Read moreWater is fundamental to life on Earth. Knowing where and how much precipitation falls globally is vital to understanding how weather and climate impact our environment, including the effects on agriculture, fresh water availability, and natural disasters. This simulation, produced by the Goddard Earth Observing System Model Version 5 (GEOS -5), shows clouds and precipitation at 7-kilometer resolution from January 1 to March 31, 2006. Simulations such as this one allow scientists to better understand the intensity and variability of precipitation worldwide and how precipitation patterns change over time. Precipitation animation of Jan 1 - Mar 31, 2006. No preview movie available yet Related pages
Simulated Clouds and Precipitable Water
Dec. 10th, 2014
Read moreTo better understanding Earth’s hydrological cycle, energy budget, and climate, scientists study moisture and clouds in the atmosphere. This simulation, produced by the Goddard Earth Observing System Model Version 5 (GEOS-5), shows precipitable water and clouds at 7-kilometer resolution from April 1 to July 31, 2006. Precipitable water is the total amount of water vapor contained within a vertical column of the atmosphere. In other words, its how much water would result if all the water in that column precipitated as rain. The amount of precipitable water in the air is small in extremely arid areas and in locations where the temperatures are very low (e.g., polar regions). Simulations such as this one allow scientists to gain new insights into atmospheric humidity and how clouds and water vapor impact precipitation and surface temperature. Clouds and precipitable water animation of Apr 1 - Jul 31, 2006. Related pages
GEOS-5 Carbon Dioxide and Carbon Monoxide Simulation for SC 2014
Dec. 9th, 2014
Read moreCarbon exists in many forms—e.g., carbon dioxide (CO2), carbon monoxide (CO)—and continually cycles through Earth’s atmosphere, ocean, and terrestrial ecosystems. This visualization, created using data from the 7-km GEOS-5 Nature Run model, shows average column concentrations of atmospheric CO2 (colored shades) and CO (white shades underneath) from May 15, 2005 to June 16, 2007. There is also a version that covers January 1, 2006 to December 31, 2006.CO2 variations are largely controlled by fossil fuel emissions and seasonal fluxes of carbon between the atmosphere and land biosphere. For example, dark red and pink shades represent regions where CO2 concentrations are enhanced by carbon sources, mainly from human activities. During Northern Hemisphere spring and summer months, plants absorb a substantial amount of CO2 through photosynthesis, thus removing CO2 from the atmosphere. Atmospheric CO, a pollutant harmful to human health, is produced mainly from fossil fuel combustion and biomass burning. Here, high concentrations of CO (white) are mainly from fire activity in Africa, South America, and Australia. Scientists use model output data such as these to help answer important questions about Earth’s climate and to help design future satellite missions.These model simulations use fossil fuel emissions estimates provided by the Emissions Database for Global Atmospheric Research (EDGAR). NASA’s Quick Fire Emissions Dataset (QFED) estimates fire emissions using MODIS fire radiative power observations. Additional, observationally constrained estimates of CO2 flux between the atmosphere and land and ocean carbon reservoirs were produced as part of NASA’s Carbon Monitoring System Flux Pilot Project (http://carbon.nasa.gov/cgi-bin/cms/inv_pgp.pl?pgid=581). Land biosphere fluxes come from the Carnegie-Ames-Stanford Approach Global Fire Emissions Database (CASA-GFED) model which incorporates MODIS vegetation classification and AVHRR Normalized Difference Vegetation Index (NDVI) data. Ocean fluxes are produced by the NASA Ocean Biogeochemical Model (NOBM) which incorporates MODIS chlorophyll observations. GEOS-5 carbon, May 15, 2005 - June 16, 2007. GEOS-5 carbon, January 1, 2006 - December 31, 2006. A preview movie at 12x speed shows some of the GOES-5 model outputs from the 7-km nature run Related pages
GEOS-5 Nature Run Collection
March 6th, 2013
Read moreDust (red), sea salt (blue), organic/black carbon (green), and sulfates (white) displayed by their extinction aerosol optical thickness.This simulation used GEOS-5 and the Goddard Chemistry Aerosol Radiation and Transport (GOCART) Model. This projection of the aerosols simulation onto a rotating globe tracks wildfires and human-initiated burning (red-yellow dots) as detected by NASA's MODIS instrument aboard the Terra and Aqua satellites. A zoomed in version of aerosols and fires on a rotating globe. Total precipitable water (white) and rainfall (colors 0-15 millimeters/hour; red=highest). Surface winds (white 0-40 meters/second) and upper-level (250 hPa) winds (colors 0-175 meters/second; red=faster). Surface temperature (colors 270-310 Kelvin) and outgoing longwave radiation at the top of the atmosphere (white) representative of clouds in the model. Through numerical experiments that simulate the dynamical and physical processes governing weather and climate variability of Earth's atmosphere, models create a dynamic portrait of our planet. This 10-kilometer global mesoscale simulation (Nature Run) using the NASA Goddard Earth Observing System Model (GEOS-5) explores the evolution of surface temperatures as the sun heats the Earth and fuels cloud formation in the tropics and along baroclinic zones; the presence of water vapor and precipitation within these global weather patterns; the dispersion of global aerosols from dust, biomass burning, fossil fuel emissions, and volcanoes; and the winds that transport these aerosols from the surface to upper-levels.The full GEOS-5 simulation covered 2 years—from May 2005 to May 2007. It ran on 3,750 processors of the Discover supercomputer at the NASA Center for Climate Simulation, consuming 3 million processor hours and producing over 400 terabytes of data. GEOS-5 development is funded by NASA's Modeling, Analysis, and Prediction Program. For More InformationSee [gmao.gsfc.nasa.gov/research/aerosol/](gmao.gsfc.nasa.gov/research/aerosol/) Related pages